

Navigating the financial markets requires a keen eye for price action and a deep comprehension of how psychology manifests on a candlestick chart. Among the vast array of candlestick patterns available to traders, this specific formation stands out as a reliable signal for identifying potential trend shifts. This classic morning star pattern serves as a beacon for those looking to exit short positions or enter new long trades at the base of a recovery. Because the configuration formed at the end of a decline is so distinct, it remains a favorite for experts in technical analysis.
In this guide, we will explore the nuances of this early stellar arrangement, comparing it to its counterpart, the evening star, and detailing how to integrate it into professional trading strategies. Whether you trade forex, stocks, or cryptocurrencies, mastering this three-candle pattern can significantly refine your trading decisions.
What Is Morning Star Pattern Formation?
This setup is a bullish reversal pattern that appears at the bottom of a downtrend. It signals that the selling pressure has exhausted itself and that buyers are beginning to take control of the market. This pattern consists of three candles that specifically illustrate a transition from bearish dominance to bullish momentum. It is a visual pattern that provides a clear map of market exhaustion.
Visual anatomy of morning star candlestick
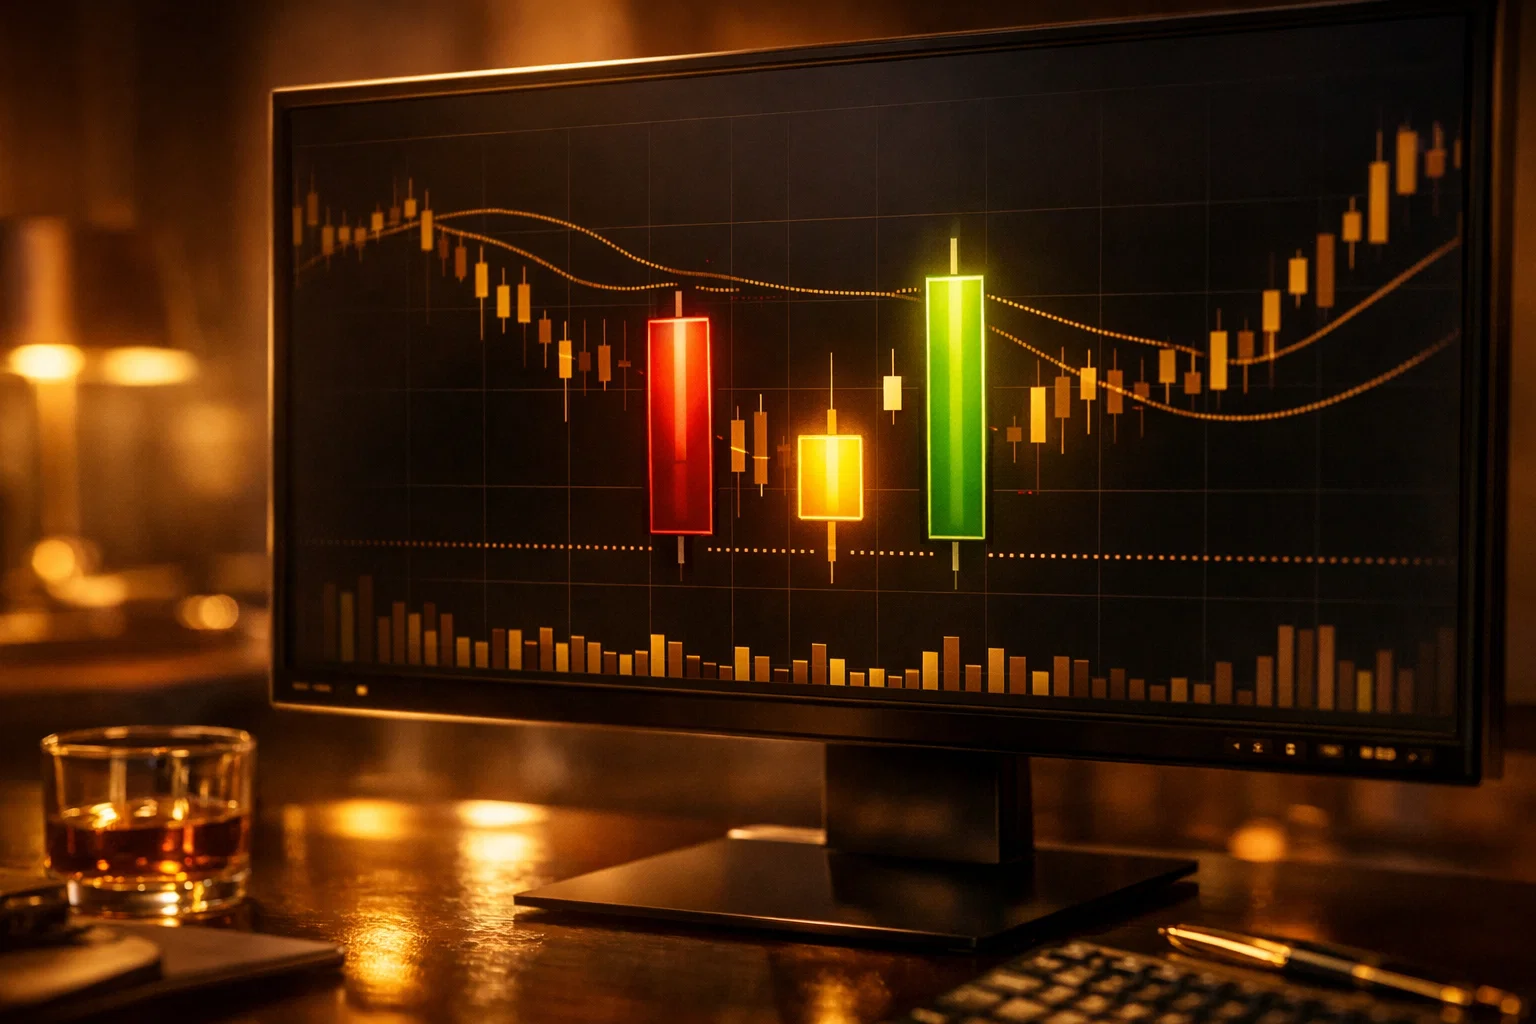
To identify the setup, you must look for a specific sequence of price action. The formation begins with a large bearish candle, reflecting the prevailing downtrend. This is followed by a small candlestick, which can be bullish, bearish, or a doji candlestick. This middle element typically gaps lower, showing a final push by sellers that fails to result in a significant price drop. The third candlestick is a large bullish candlestick that closes well into the body of the first candle, confirming the reversal. This pattern consists of three distinct phases of sentiment shift.
Psychology behind three-day pattern formation
The psychology of the reversal is a story of shifting power. On the first day, the bears are in complete control, pushing prices lower with confidence. On the second day, a gap down occurs, but the narrow range of the candle suggests that bears are losing their conviction. The appearance of a candlestick with a small body after a long decline indicates indecision. On the third day, the bulls charge back, forcing prices higher and trapping those who sold at the lows. This sudden shift often leads to a sustained upward move as short-sellers cover their positions and new buyers enter.
What this chart pattern indicates about market sentiment
When a morning star appears, it indicates that the market has reached a point of price discovery where the value is perceived as too low to justify further selling. In technical analysis, this chart setup is viewed as a “floor.” It suggests that the bearish sentiment is no longer supported by trading volume or fundamental pressure. While a single early signal is bullish, seasoned traders often wait for the third candle to close to ensure the formation is fully formed before making a move. Often, this pattern that signals a reversal can be found at historical price lows.
How to Spot the Morning Star Pattern on Candlestick Chart
Spotting the arrangement on a candlestick chart requires patience and strict adherence to the rules of its formation. This is a three-candle pattern that rewards those who wait for the final confirmation. Because it is a three-candle sequence, premature entries can lead to losses if the third candle fails to materialize as a strong bullish signal.
First candlestick: Strong bearish trend continuation in forex and stocks
The first candlestick must be a long, dark, or red candle that continues the existing downtrend. In the forex market, this often represents a period of high selling interest sparked by economic data or technical breakdowns. This candle establishes the “fear” in the market, making the subsequent reversal even more significant.
Second candle: Market indecision and gap down
The second candle is the most critical part of the setup. It should ideally gap away from the first candle’s body. The candle itself has a small body, often acting as a focal point of indecision. This small candlestick with a small body shows that the market is at a stalemate. The gap down indicates that even though sellers tried to push the price lower at the open, they could not maintain the downward momentum throughout the session. This middle candlestick acts as a pivot point.
Third candlestick: Bullish candlestick pattern confirmation
The third candlestick is the confirmation candle. It must be a bullish candle that opens higher than the second candle and closes at least halfway up the body of the first candle. A large bullish candlestick that closes near its high is a strong indication that the bullish reversal pattern is valid. The higher the close of this third candle, the more powerful the expected move. This pattern consists of three candles that work in harmony to confirm a trend change.
Criteria to identify the morning star in technical analysis
| Feature | Requirement |
|---|---|
| Market Context | Must occur after a sustained downtrend |
| First Candle | Long bearish body |
| Second Candle | Small body (star) or Doji, ideally gapping down |
| Third Candle | Bullish body closing at least 50 percent into the first candle |
| Confirmation | Increase in trading volume on the third day is preferred |
Effective Morning Star Pattern Trading Strategies
Developing robust trading strategies involves more than just identifying the formation. It is a candlestick pattern that signals a shift in demand. It requires context, such as using the morning star pattern alongside other indicators to increase the probability of success.
Strategy 1: Using the this pattern with support and resistance
One of the most effective ways to trade this pattern is to look for it at major support levels. If the formation occurs exactly on a historical support line or a round psychological number, the accuracy of the morning star increases significantly. Since the pattern that appears at support is much stronger, traders wait for the arrangement to form, then enter a long position with a stop loss just below the support zone.
Strategy 2: Trading the morning star candlestick with Relative Strength Index (RSI)
The Relative Strength Index (RSI) is an excellent tool for spotting oversold conditions. When using the morning star pattern bullish signals, check if the RSI is below 30 during the formation of the first or second candle. If the RSI begins to curve upward as the third candle closes, it provides a secondary layer of confirmation that a bullish reversal is underway.
Strategy 3: Best practices to trade this pattern using moving averages
Moving averages can act as dynamic support. A classic setup forming on the 50-day or 200-day moving average is a highly sought-after signal for swing traders. In this strategy, the moving average serves as the foundation for the bullish candlestick pattern, suggesting that the long-term trend is resuming or a new one is beginning. Experienced traders use this pattern may to re-enter a long-term uptrend after a pullback.
Strategy 4: Integrating Fibonacci levels with candlestick patterns
Fibonacci retracement levels provide hidden areas of support. If the setup is a bullish reversal that occurs at the 61.8 percent or 78.6 percent Fibonacci retracement level of a previous major move, it signals that the correction is over. Combining star candlestick patterns with Fibonacci levels helps in pinpointing high-probability reversal zones. This star pattern is a bullish indicator when aligned with deep retracements.
Strategy 5: Using volume to confirm morning star pattern bullish signals
Trading volume is a vital health indicator for any arrangement. For a morning pattern bullish signal to be considered strong, the trading volume on the first candle should be high (panic selling), and the volume on the third candle should be even higher (aggressive buying). This volume “U-shape” confirms that big players are stepping in to support the price. This pattern is easy to verify when volume spikes are present.
Morning Star vs Other Reversal Formations
Understanding how the dawn signal relates to other candlestick structures helps in distinguishing between high-quality and low-quality signals.
Morning star and doji morning star differences
A doji morning star occurs when the middle candlestick is a doji. This version of the arrangement suggests even greater indecision than a standard formation. A morning star and doji morning formation is often considered more potent because the doji represents a perfect balance between buyers and sellers before the bulls take over.
Morning star and evening star candlestick comparisons
These two formations are mirror images of each other. While one signals a bullish reversal, the evening pattern is a bearish reversal structure that appears at the top of an uptrend. The latter consists of a large bullish candle, a small candle, and a large bearish candle. Both star and evening star candlestick arrangements are essential for any trader’s toolkit.
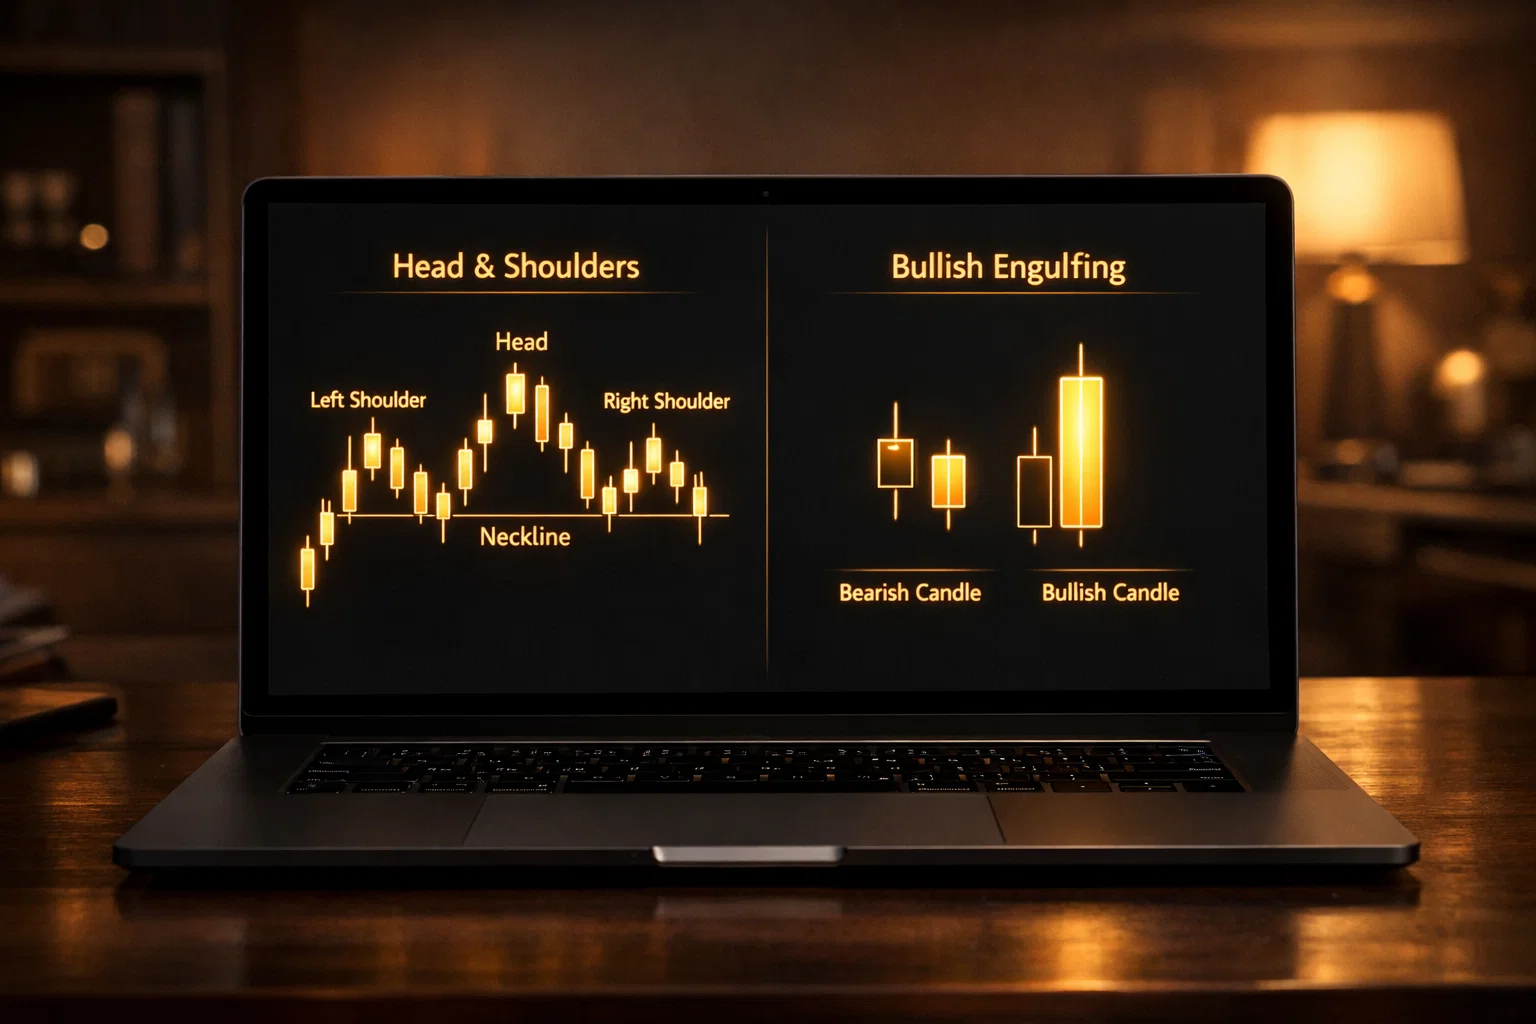
Morning star vs bullish engulfing candlestick patterns
The bullish engulfing is a two-candle sequence where the second candle completely covers the first. In contrast, the dawn signal consists of three candles. The morning star provides more data points regarding the transition of power, making it arguably more reliable in some cases, although both are strong bullish reversal pattern signals.
Comparing star and evening star patterns for market entry
| Pattern | Market Trend | Signal Type | Number of Candles |
|---|---|---|---|
| Morning Star | Downtrend | Bullish Reversal | 3 |
| Evening Star | Uptrend | Bearish Reversal | 3 |
| Morning Doji Star | Downtrend | Strong Bullish Reversal | 3 |
| Evening Doji Star | Uptrend | Strong Bearish Reversal | 3 |
How to Trade the Morning Star Effectively
To trade this pattern successfully, you must have a disciplined approach to entry and exit. It is best to trade this pattern only after full confirmation of the third candle.
Best entry points for trading the morning star pattern
The safest entry point is at the close of the third candlestick. Some aggressive traders may enter on the candle after the formation if it breaks the high of the entire arrangement. However, waiting for the third candle’s close ensures that the morning star signals are fully confirmed and not just a temporary bounce.
Stop-loss placement below the bullish candlestick low
Risk management is paramount. A standard stop-loss placement is just below the lowest point of the middle candlestick. If the price drops below this level, the morning star candlestick pattern is invalidated, and the bearish trend may be resuming. This provides a clear and objective exit point.
Setting profit targets on a candlestick chart
Profit targets can be set using previous resistance levels or a fixed risk-to-reward ratio, such as 1 to 2. Approximately 70-89 percent of retail investor accounts lose money when trading CFDs, often due to poor exit strategies. Using the reversal to identify a shift is only half the battle; ensuring you take profit at logical chart hurdles is the other half.
Risk management for using the morning star in live markets
Never risk more than 1-2 percent of your account balance on a single trade this pattern produces. Even the most classic setup can fail due to sudden fundamental shifts or black swan events. Diversification and position sizing remain the most important aspects of long-term survival in the markets.
Reliability and Accuracy of the Morning Star

The accuracy of the morning star is generally high, but it is not infallible. Its performance varies significantly depending on the market and the timeframe used.
Historical accuracy of the morning star pattern in different markets
In the stock market, the dawn signal has a strong historical track record because markets have a natural long-term bullish bias. In forex, where markets often trend or range based on interest rate differentials, the morning star signals are most reliable when they align with the broader macroeconomic backdrop.
Performance across various timeframes
This formation appears on all timeframes, from 1-minute charts to monthly charts. Generally, the three-candle pattern is more reliable on higher timeframes like the daily or weekly chart. Small-timeframe sequences are often subject to noise and may result in false signals.
Common reasons for failed candlestick patterns
The setup may fail if it forms in the middle of a consolidation zone rather than after a clear downtrend. Additionally, if the third candle does not have sufficient volume or closes below the midpoint of the first candle, the reversal lacks conviction. External news events can also override technical setups instantly.
Tips to identify a morning star with high probability
- Look for a gap between the first and second candle bodies.
- Ensure the third candle has a large body and closes high.
- Verify that the arrangement occurs at a significant historical support level.
- Use a volume oscillator to check for rising buying pressure.
Limitations of the Morning Star Pattern
Like all technical tools, the setup has its pros and cons. Understanding these helps you trade this pattern more effectively.
Advantages of spotting the morning star pattern early
Spotting the morning star pattern early allows you to enter a trade at the very beginning of a potential new trend. This provides an excellent risk-to-reward ratio, as your stop loss is relatively tight compared to the potential upside of a multi-day or multi-week reversal.
Clear risk-to-reward ratios for traders
Because the arrangement has a defined structure, it is easy to calculate your risk. The distance from the entry to the bottom of the middle candlestick is your risk. You can then aim for a target that is twice or three times that distance, ensuring that your winning trades more than compensate for your losing ones.
Market limitations of the morning star in low liquidity
In low-liquidity markets, such as certain penny stocks or exotic forex pairs, candlestick formations can be erratic. The gaps that are so important to identify the reversal might be caused by lack of interest rather than a shift in sentiment. Therefore, it is best to trade this pattern on major assets with high trading volume.
Potential for false signals during sideways trends
The star pattern is a bullish reversal structure, meaning it requires a trend to reverse. If the market is moving sideways in a range, a reversal signal might appear, but it won’t lead to a major move. Traders should avoid using the morning star candlestick in non-trending environments.
Real World Examples of Morning Star Patterns
Forex market reversal case study
In early 2023, the EUR/USD pair was in a steady decline. A classic morning star pattern formed on the daily chart near the 1.0500 support level. The first candle was a large bearish candle, the second was a doji candlestick that gapped down slightly, and the third was a large bullish candlestick that closed at 1.0650. Traders who entered here saw a 300-pip move over the next two weeks.
Stock market morning star pattern bullish example
Consider a tech stock that has sold off after an earnings report. If the price reaches a major 200-day moving average and forms the reversal, it suggests that the bad news has been priced in. This was seen in several major semiconductor stocks in late 2022, where the morning star signals marked the definitive bottom of the bear market.
Crypto trading results using the morning star
Bitcoin and Ethereum frequently display these formations at the end of flash crashes. Because crypto is highly volatile, these sequences often form very quickly. Identifying a morning star forming on a 4-hour crypto chart can often lead to a 5-10 percent price recovery as liquidated shorts are replaced by spot buyers.
Frequently Asked Questions About Star Patterns
Is morning and evening star analysis reliable for beginners?
These arrangements are considered very accessible for beginners because they are visually distinct and have clear rules for identification. Unlike more subjective indicators, these structures offer a concrete three-candle sequence that helps new traders develop the discipline of waiting for confirmation. While no arrangement is perfect, the logical flow from bearish to neutral to bullish sentiment makes it an excellent starting point for those learning technical analysis.
What follows the morning star pattern in a healthy trend?
In a healthy market environment, the completion of the setup is typically followed by a series of higher highs and higher lows. This indicates that the reversal has transitioned into a new bullish trend. Traders often look for a second bullish candle after the morning star to confirm that the momentum is sustained. If the price continues to hold above the third candle’s close, it suggests that the bulls have successfully shifted the market’s trajectory.
How many days does it take to identify a morning star?
A standard arrangement consists of three candles, so on a daily chart, it takes exactly three days to form. However, the identification process technically concludes at the close of the third day. Traders should avoid trying to predict the structure before the third candle finishes its session, as the final candle must close strongly to validate the reversal. On shorter timeframes, such as an hourly chart, the sequence would take three hours to complete.
Can morning stars be used for day trading?
Yes, they can be used for day trading on shorter timeframes such as the 5-minute or 15-minute charts. However, traders should be aware that arrangements on these timeframes are more susceptible to market noise and sudden volatility. To increase success when day trading, it is advisable to only trade this pattern when it occurs at significant intraday support levels or during periods of high volume, such as the New York or London market opens.
What is the difference between morning star vs evening star pattern reliability?
Both reversal formations are considered highly reliable signals when they occur after a significant trend. Historically, some traders find that the evening version may lead to faster moves because market participants often panic during sell-offs, whereas the morning star leads to a more gradual climb. Ultimately, their reliability depends heavily on the surrounding market context and the presence of supporting indicators like volume and support or resistance levels.


