


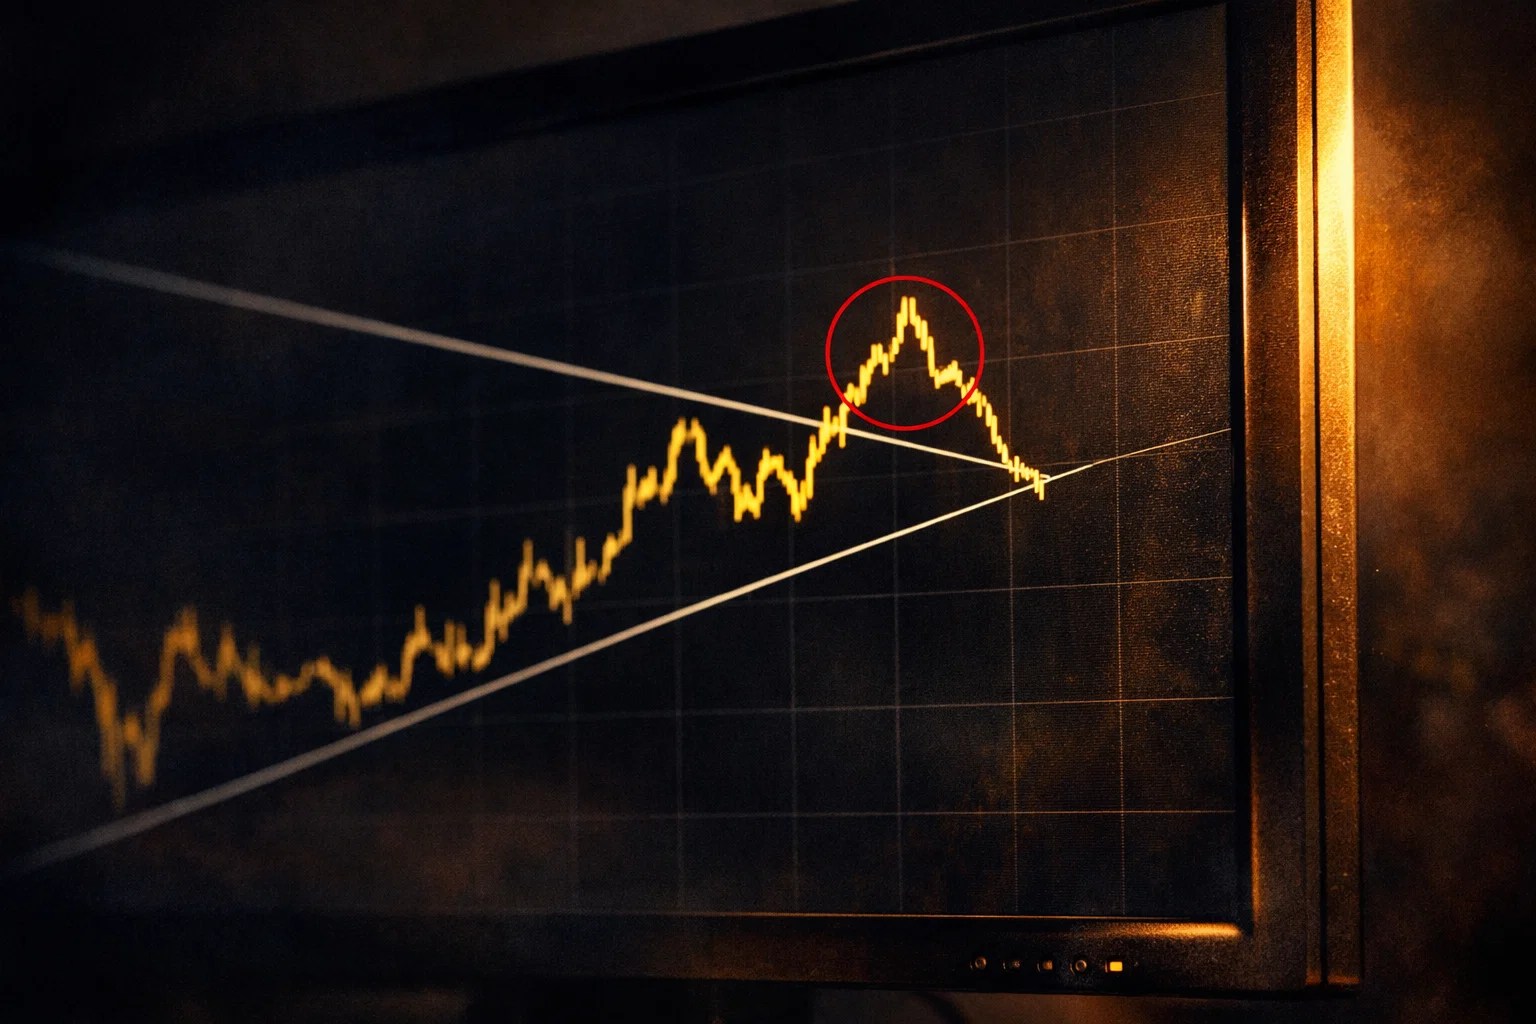
The world of technical analysis is filled with visual cues that help a trader predict future price movement. Among the most recognizable and versatile is the symmetrical triangle pattern. This chart formation represents a period of consolidation before the price is forced to breakout or breakdown. Because it does not have an inherent directional bias, it requires a disciplined approach and an understanding of how market forces interact within its boundaries.
What is the Symmetrical Triangle Pattern?
The equilateral structure is a chart formation where the price of an asset moves in an increasingly narrow range, creating a triangle shape on the chart. This model is formed when the price makes lower highs and higher lows, meaning both buyers and sellers are becoming more aggressive, but neither side has yet gained full control. It is often considered a continuation pattern, although it can occasionally lead to reversals depending on the broader market context.
Symmetrical Triangles in Technical Analysis
In the realm of technical analysis, these setups are viewed as areas of indecision. Unlike an ascending or a descending triangle, which have one flat horizontal boundary, the converging formation features two trendlines with similar slopes. This pattern indicates that the market is catching its breath. Experienced market analysts suggest that these geometric figures act like a coiled spring; the longer the price remains inside the consolidation, the more explosive the eventual move tends to be.
Pattern Formation and Geometric Requirements
To identify a symmetrical triangle pattern, you must look for specific geometric traits. A valid setup requires at least two lower highs and two higher lows to draw the trendlines. These lines must converge toward a point known as the apex.
| Requirement | Description |
|---|---|
| Trendlines | Two converging lines (upper descending, lower ascending) |
| Touches | Minimum of 4 points (2 highs and 2 lows) |
| Shape | Roughly balanced around a central horizontal axis |
| Convergence | The lines must intersect at a future point (Apex) |
Market Equilibrium and Consolidation Phases
A symmetrical triangle forms when there is a temporary balance between supply and demand. During this consolidation phase, the trading volume often declines as participants wait for a clearer signal. This structure appears when the market is uncertain about the next major catalyst. It is a period where the range of price movement contracts, signaling that a breakout direction is imminent. Understanding these models involves recognizing that this equilibrium is fragile and will eventually be broken by a surge in volatility.
How to Identify a Symmetrical Triangle Pattern on Chart

Identifying the setup correctly is the first step toward successful trading. The key is to look for the distinct narrowing of the price action that characterizes this specific chart pattern.
Identifying Symmetrical Triangle Chart via Trendlines
To identify the symmetrical triangle, you should start by connecting the peaks and troughs. Use a straight line to connect the lower highs and another to connect the higher lows. If the resulting lines move toward each other at roughly the same angle, you have likely found a balanced chart setup. It is important to ensure that the price touches these lines cleanly without too many “fake” spikes outside the formation before the actual breakout occurs.
Minimum Required Touchpoints for Validation
For a model to be considered a valid symmetrical triangle, it must have at least four touchpoints. This means the price should touch the upper descending line at least twice and the lower ascending line at least twice.
- First High (Starting point of the upper trendline)
- First Low (Starting point of the lower trendline)
- Second High (Must be lower than the first high)
- Second Low (Must be higher than the first low) Following these points, the pattern is often considered mature and ready for a potential breakout or breakdown.
What Does Symmetrical Triangle Show to Trader?
This setup show the trader a tug-of-war between bulls and bears. It indicates that the market is narrowing its focus and that a period of low volatility is about to end. For the trader, this pattern serves as a warning to prepare for a significant move. Because the formation is neutral, it tells you to stay patient and wait for the price to commit to a direction rather than guessing which way it will go.
Core Types of Symmetrical Triangle Patterns
While the symmetrical triangle pattern is neutral in its early stages, it eventually takes on a directional bias once the price breaks out. Depending on the prior trend and the breakout direction, it can be categorized into two main outcomes.
Bullish Symmetrical Triangle Pattern
A bullish setup typically occurs during an existing bullish trend. In this scenario, the triangle forms as a temporary pause in the upward movement. While the pattern itself is neutral, the statistical probability in a strong market often favors a bullish breakout. When the price breaks the upper boundary of the formation with an increase in trading volume, it confirms the setup as a bullish continuation model.
Bearish Symmetrical Triangle
Conversely, a bearish symmetrical triangle often appears during a bearish trend. As the price drops, it eventually enters a consolidation phase where lower highs and higher lows are formed. A bearish breakout occurs when the price falls below the lower ascending trendline. This breakdown from the balanced structure suggests that sellers have overwhelmed buyers and the downward price movement is likely to resume.
Symmetrical Triangle as Continuation Pattern
In most textbooks, the symmetrical triangle is a continuation pattern. This means it is expected that the price will exit the triangle in the same direction it entered.
- If the prior trend was up, it is a bullish continuation setup.
- If the prior trend was down, it is a bearish continuation model. However, traders should wait for the actual breakout point to be breached before making trading decisions, as reversals can and do happen.
Trade Symmetrical Triangle Pattern with Effective Trading Strategies
To trade these chart patterns successfully, you need a repeatable system. It is not enough to just see the setup; you must know exactly when to enter a trade and how to manage it.
Breakout and Breakdown from a Symmetrical Triangle
The most common way to trade a symmetrical triangle pattern is to wait for a definitive close outside the triangle.
- Wait for the price to close above the upper trendline (Bullish) or below the lower trendline (Bearish).
- Look for an increase in trading volume to confirm the strength of the move.
- Enter a trade in the direction of the breakout.
- Avoid entering exactly on the line; wait for a “buffer” or a retest of the broken line to ensure the move is legitimate.
Trade with a Symmetrical Triangle using Bullish and Bearish Signals
When you trade with a symmetrical triangle, you can use the internal waves to anticipate the move. Some aggressive traders buy at the lower ascending line and sell at the upper descending line while the model is still forming. However, the most reliable specific trading strategies focus on the exit. Approximately 70-89% of retail investor accounts lose money when trading complex instruments; therefore, waiting for a confirmed bullish breakout or bearish breakout is often the safer choice for most participants.
Technical Analysis Tools: RSI, MACD and Volume
Using symmetrical triangles in isolation can be risky. To enhance your accuracy, incorporate other technical analysis tools:
- Volume: Trading volume should ideally diminish as the formation forms and then spike during the breakout.
- RSI: The Relative Strength Index can help you identify if the asset is overbought or oversold as it nears the apex.
- MACD: Moving Average Convergence Divergence can signal a shift in momentum before the price breaks the boundary of the pattern.
Trade Symmetrical Triangle Chart Patterns during Trend Reversals
While usually considered a continuation model, this pattern appears at market tops or bottoms as a reversal signal occasionally. If a balanced structure forms after a long-extended move and breaks in the opposite direction of the trend, it suggests a major trend change. This requires extra caution and stronger volume confirmation to ensure you are not being trapped in a false move.
Developing Symmetrical Triangle Trade Setup

A professional trade setup requires precise numbers. You must know your entry, your target, and your risk before you put any capital at work.
Calculating Price Target for Entry and Exit
To find the price target, traders use a method called the “measured move.”
- Measure the height of the triangle at its widest part (the base).
- Add this value to the breakout point for a bullish trade.
- Subtract this value from the breakdown point for a bearish trade. Formula: Price Target = Breakout Price + (High of Base – Low of Base)
Setting Effective Stop-Loss Orders
Risk management is the hallmark of a successful trader. When you trade symmetrical triangle chart patterns, the stop-loss is typically placed inside the formation.
- For a bullish trade: Place the stop-loss below the most recent higher low inside the setup.
- For a bearish trade: Place the stop-loss above the most recent lower high. This ensures that if the model but then reverses direction, you exit the position before a small loss becomes a large one.
Risk Management in Pattern Trading
Never risk more than a small percentage of your account (e.g., 1-2%) on a single trade. Because these setups can lead to volatile swings, ensure your position size reflects the distance between your entry and your stop-loss. Using this pattern helps traders stay objective and avoid emotional making trading decisions.
Managing False Breakouts that Occur in Symmetrical Triangle Patterns
One of the greatest challenges for a trader is the “fakeout.” This is when the price breaks outside the triangle but quickly moves back inside and heads in the opposite direction.
Why Fakeouts Happen in Symmetrical Triangles
False breakouts occur in symmetrical triangle patterns due to low liquidity or institutional “stop hunting.” Sometimes, a large participant will push the price out of the range to trigger stop-loss orders, creating the liquidity they need to enter a large position in the opposite direction. Recognizing that the formation is neutral until confirmed is vital to avoiding these traps.
Identifying False Signals via Volume Analysis
The best way to filter out false signals is to monitor trading volume. A legitimate breakout is almost always accompanied by a significant increase in trading volume. If the price moves outside the triangle on low volume, there is a high probability that the move will fail. As a general rule, traders should wait for a candle to close outside the setup before considering the breakout valid.
Protective Measures for Failed Patterns
If you enter a trade and the price reverses back into the triangle, it is often a sign that the pattern is failing. Protective measures include:
- Using a “two-candle” rule (waiting for two consecutive closes outside).
- Using a volatility filter (Average True Range).
- Respecting your stop-loss without exception.
Symmetrical Triangle Example and Case Studies
Looking at historical data helps confirm how these models behave in different market environments.
Real-World Symmetrical Triangle Chart in Forex Markets
In the Forex market, the EUR/USD pair frequently exhibits balanced structures during the transition between the London and New York sessions. For example, in 2023, a symmetrical triangle formed on the H4 chart over two weeks. The price eventually broke the upper descending line, leading to a 200-pip move that matched the height of the triangle base exactly.
Crypto Chart Pattern Case Study
Bitcoin often uses the symmetrical triangle as a consolidation tool after a massive bull run. When the bullish breakout occurred, it signaled the start of a parabolic move. Crypto traders often use this setup because it helps them manage the extreme volatility inherent in digital assets.
Stock Market Application and Outcomes
In the stock market, blue-chip stocks often enter a symmetrical triangle formation before earnings reports. If the news is positive, a bullish setup forms and breaks upward. If the news is disappointing, a bearish trend might begin with a breakdown.
Symmetrical Triangles vs Other Chart Patterns
It is easy to confuse different types of triangles. Knowing the differences between a symmetrical triangle and other formations will improve your technical analysis accuracy.
Differences Between a Symmetrical Triangle and Pennant
A symmetrical triangle and pennant look similar, but they differ in duration and preceding move.
- Pennant: Very short term (1-3 weeks), preceded by a sharp, nearly vertical “pole.”
- Symmetrical Triangle: Longer term (weeks to months), formed by a more gradual consolidation.
Symmetrical Triangles vs Ascending and Descending Triangle
| Feature | Symmetrical | Ascending | Descending |
|---|---|---|---|
| Upper Line | Descending | Horizontal (Flat) | Descending |
| Lower Line | Ascending | Ascending | Horizontal (Flat) |
| Bias | Neutral | Bullish | Bearish |
Comparison with Expanding Triangle and Wedges
An expanding triangle (or megaphone pattern) is the opposite of a symmetrical triangle; the price range gets wider over time. Wedges, on the other hand, have both trendlines sloping in the same direction (either both up or both down). Converging models are unique because of their contracting nature from opposite directions.
Advantages of Symmetrical Triangle Pattern and Disadvantages
Every trading tool has its strengths and weaknesses. Understanding the advantages of symmetrical triangle pattern usage is just as important as knowing its flaws.
Key Benefits for Day Traders and Swing Traders
One of the primary advantages of symmetrical triangle pattern usage is that it provides very clear entry and exit points. It offers a high reward-to-risk ratio because the stop-loss is usually placed close to the entry point, while the price target is based on the full height of the triangle. Additionally, the setup helps traders remain patient, preventing overtrading during sideways markets.
Main Disadvantages of Symmetrical Triangle Pattern
The main disadvantages of this pattern include the frequency of false breakouts. Because the model indicates a neutral market, it is easy to get “chopped up” if the price oscillates around the trendlines without committing to a direction. Furthermore, identifying the equilateral structure can be subjective; two traders might draw the lines slightly differently, leading to different entry points.
Success Rate and Reliability Factors
No chart setup is 100% reliable. The success of a symmetrical triangle trade often depends on the timeframe. Generally, patterns on daily or weekly charts are considered more reliable than those on 1-minute or 5-minute charts. According to various backtesting studies, balanced formations have a success rate of approximately 60-70% when traded in the direction of the primary trend with volume confirmation.
Common Mistakes to Avoid When You Trade a Symmetrical Triangle Pattern
Even with a perfect setup, errors in execution can lead to losses. Avoiding these common pitfalls will keep your capital safe.
Entering Trades Too Early Without Confirmation
The most frequent mistake is “anticipating” the breakout. A trader might see the triangle forming and buy at the bottom line, assuming it will break upward. However, since the formation is neutral, it could just as easily break downward. Always wait for the price to actually close outside the setup.
Ignoring Broader Market Context
If the entire market is in a heavy bearish trend, a bullish symmetrical triangle pattern is much more likely to fail or result in a bearish breakout. Never analyze a setup in a vacuum; always look at the higher timeframe trend and major economic news.
Mistakes in Identifying Descend or Ascend Lines
If you force a triangle shape onto a chart where it doesn’t naturally exist, your trendlines will be inaccurate. Ensure your lines connect at least two distinct peaks and two distinct troughs. If the lines are not truly converging, you might be looking at a channel or a different formation entirely.
FAQ
Is the symmetrical triangle pattern bullish or bearish?
This pattern is considered a neutral formation that can lead to either a bullish or a bearish outcome. While it often acts as a continuation model, meaning it usually breaks in the direction of the prior trend, its definitive bias is only established once the price breaks through one of the two converging trendlines. Traders should avoid assuming a direction until a confirmed breakout or breakdown occurs with supporting volume.
How to calculate price target for breakout?
To calculate the price target for a symmetrical triangle breakout, you must first measure the vertical height of the formation at its widest point, which is the base where the model first began to form. Once you have this height in pips or points, you add it to the breakout price if the movement is upward or subtract it from the breakdown price if the movement is downward. This method provides a clear objective goal for the trade based on the volatility present during the setup development.
How does symmetrical triangle differ from descend or ascend patterns?
It differs from an ascending or a descending triangle primarily through the slope of its trendlines. In an ascending, the upper line is flat while the lower line rises, creating a bullish bias. In a descending, the lower line is flat while the upper line falls, creating a bearish bias. The equilateral setup is unique because both lines are sloping toward each other at similar angles, reflecting a state of complete market equilibrium without an initial directional preference.


