

Chart analysis often involves recognizing recurring visual formations that market participants associate with price behavior. Among the more widely discussed of these formations is the pennant, a pattern typically described as a continuation pattern that can appear during a pause within an existing trend.
This type of formation is frequently referenced in technical analysis literature as a way of describing market consolidation following a strong directional move. Examining how the pattern is structured can offer insight into general market behavior and the way participants interpret price action.
Pennant Chart Pattern in Technical Analysis

This section outlines the general structure and context typically associated with this formation in technical analysis discussions.
Define and Understand Pennant Formations
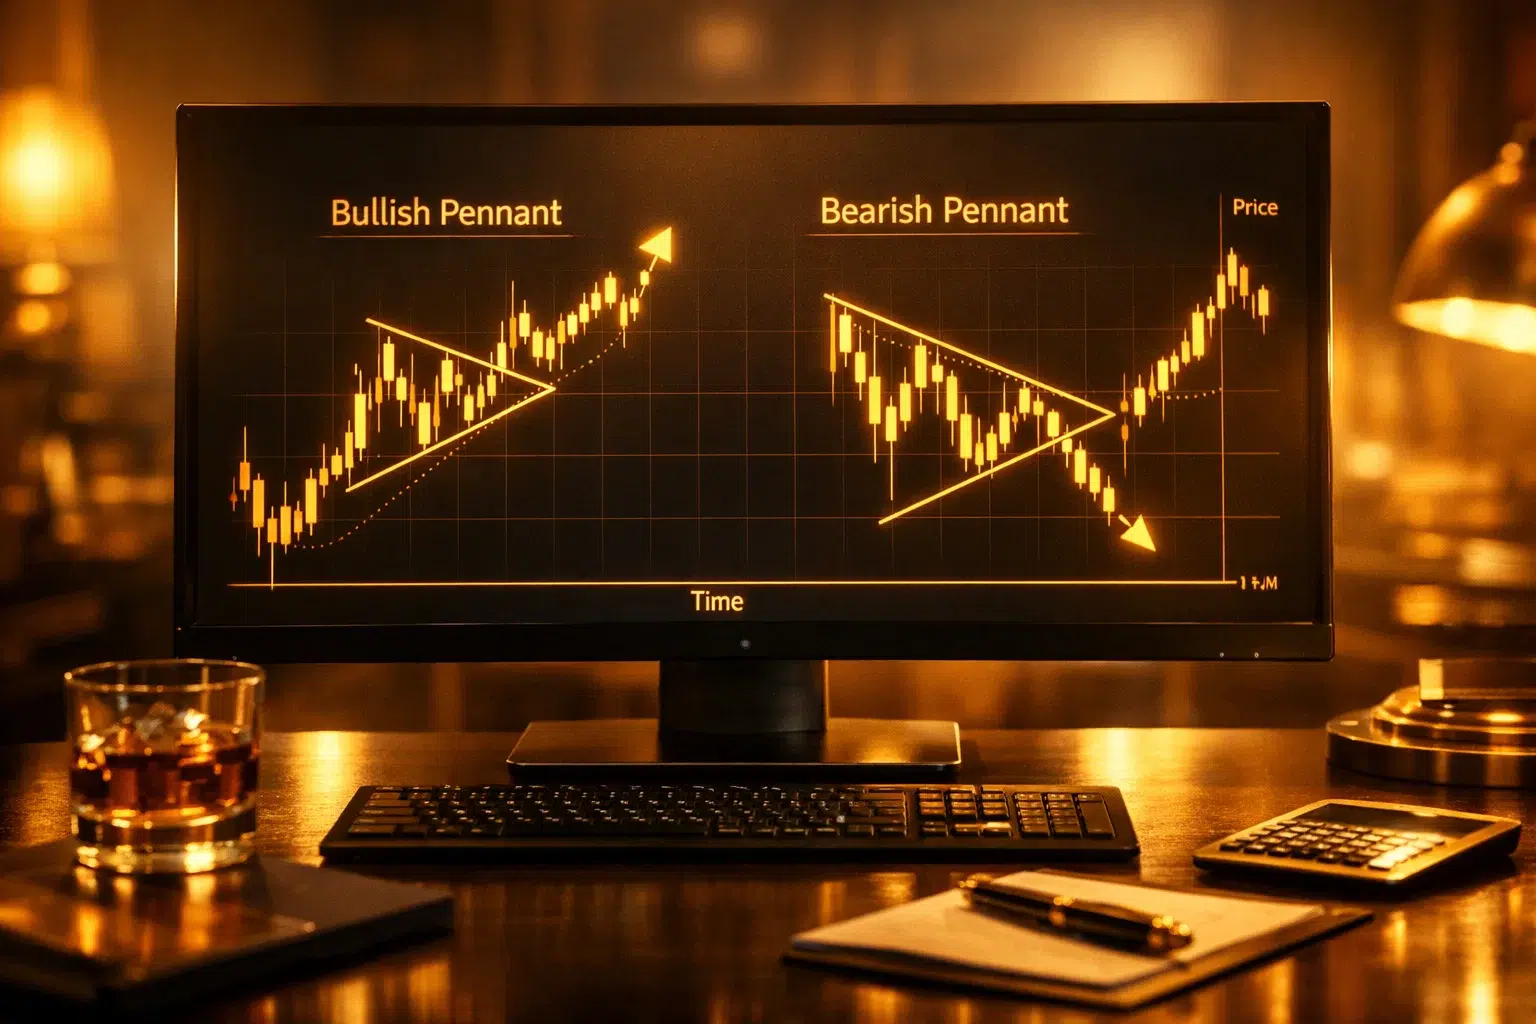
A pennant is generally described as a chart formation associated with the potential continuation of a trend. It typically appears after a sharp, near-vertical price move, in what is often characterized as a pause in market activity. Visually, the formation is associated with two converging trendlines forming a small triangular shape. This formation is commonly referenced in technical analysis as a way of describing a temporary equilibrium between buyers and sellers within an existing trend.
Three-Phase Pennant Formation Process
The development of this formation is commonly described as following a general structural sequence:
- The flagpole: a sharp, pronounced price move in either direction.
- The pennant: a consolidation phase where price narrows between converging lines.
- The breakout: a subsequent move beyond the triangle’s boundaries.
This sequence is often described in terms of shifting volatility, moving from a sharp move to a narrowing range and then to renewed price movement.
Flag and Pennant Patterns: Key Differences
Flags and pennants are both categorized as continuation patterns, though their internal geometry differs. A flag is typically described as having a small rectangular shape with parallel trendlines, while a pennant features converging trendlines that meet near a point. Both are generally discussed as following a sharp price move, with some form of subsequent move commonly referenced afterward. Understanding this distinction is often described as useful for interpreting chart formations more accurately across different market conditions.
When Pennant Pattern Occurs in Market Trends
This formation is more often discussed in connection with markets exhibiting high participation and clear directional bias, such as during notable news flow or earnings periods. It is less frequently associated with sideways or range-bound conditions. Across asset classes including forex, equities, and commodities, the pattern is generally described as forming when a dominant trend appears to be pausing rather than reversing.
Key Characteristics of the Pennant Pattern
Several recurring features are commonly cited when this formation is discussed in technical analysis resources, ranging from the initial price move to the volume behavior that accompanies it.
Sharp Price Move and Flagpole Construction
The flagpole is generally described as the initial, more aggressive portion of the formation. A bullish configuration is typically associated with a rapid upward move, while a bearish configuration is typically associated with a steep decline. Analysts often note that without this preceding sharp move, the resulting shape would more likely be characterized as a standard consolidation rather than as this specific continuation formation.
Consolidation Phase and Converging Triangle Trendlines
The consolidation phase, sometimes referred to as the body of the formation, is described as a narrowing range following the flagpole. During this phase, highs are commonly observed to decline gradually while lows rise, reflecting reduced directional conviction among participants. Multiple touches along each trendline are often referenced as a feature analysts look for when identifying this geometry.
Significance of Volume Changes During the Formation
Trading volume is frequently discussed as a reference point in technical analysis generally. A decline in volume during the narrowing phase, followed by an increase around the breakout phase, is commonly cited in discussions of this pattern. This shift in volume is sometimes interpreted as reflecting changing participation levels rather than as a guaranteed signal of future direction.
Chart Timeframes to Identify the Pennant Pattern
This formation has reportedly been observed across a wide variety of timeframes, ranging from short intraday charts to longer-term weekly charts. Some technical analysis discussions associate longer timeframes with different characteristics than shorter ones, as shown below.
| Timeframe | Typical Duration Observed | Frequency of Discussion |
|---|---|---|
| Intraday (5m–15m) | 1 to 3 hours | Commonly referenced |
| Short-term (1h–4h) | 1 to 3 days | Frequently referenced |
| Swing (Daily) | 1 to 3 weeks | Frequently referenced |
Different Types of Pennant Patterns

This formation is generally categorized into two broad variations, distinguished primarily by the direction of the preceding flagpole and the trend it is associated with.
Bullish Pennant Pattern Mechanics
A bullish pennant is generally described as forming during a period associated with an upward trend. Following a rapid price increase, a consolidation phase forms a small triangular shape. As price approaches the narrowing point of the converging lines, a move beyond the upper boundary is sometimes referenced in technical discussions as aligning with the broader upward trend.
Bearish Pennant Pattern Mechanics
Conversely, a bearish pennant is generally described in connection with a downward trend. Following a pronounced decline, price is described as consolidating in a narrow range before a subsequent move beyond the lower boundary, which is sometimes discussed as aligning with the preceding downward trend.
Symmetrical Triangle vs Pennant Chart
It is easy to confuse a larger symmetrical triangle with a pennant. A distinguishing factor commonly cited is duration and context: symmetrical triangles can be associated with either trend continuation or reversal and often develop over a longer period, while pennants are typically discussed in connection with a shorter timeframe following a sharp preceding move.
Determining the General Classification of a Pennant
Classification of a pennant as bullish or bearish is typically associated with the direction of the preceding flagpole:
- An upward-pointing flagpole is generally associated with a bullish classification.
- A downward-pointing flagpole is generally associated with a bearish classification.
Because this formation is categorized as a continuation pattern, market commentary often describes an expectation, though not a certainty, that subsequent movement could align with the original trend direction.
Common Pennant Pattern Discussion Points
This section summarizes how this formation is generally framed in broader market commentary, rather than as a set of instructions to apply.
Features Commonly Referenced When Evaluating Signals
Some market commentary references general features when this formation is being described, including:
- Whether a clear, sharp flagpole preceded the consolidation.
- Whether the consolidation shows multiple touches along each trendline.
- Whether volume appears to decline during the formation phase.
- Whether price has moved decisively beyond the trendlines on a later candle.
General Discussion of Breakout-Related Commentary
Commentary on this formation sometimes references the upper trendline area as a point of interest in a bullish configuration, and the lower trendline area in a bearish configuration. Activity occurring inside the triangle prior to any defined move is generally described in technical literature as carrying greater uncertainty, since the formation’s geometry has not yet been completed. Waiting for a more decisive move beyond the trendlines is commonly discussed as a consideration in technical analysis literature, though this is presented descriptively rather than as guidance.
General Risk-Related Commentary in Pattern Literature
Risk-related concepts are commonly referenced in broader technical analysis literature in connection with chart formations generally, including this one. Such commentary often notes that a deep return into the triangle following an initial move beyond its boundaries is sometimes interpreted as a sign that the formation’s earlier signal may not be developing as commonly described.
General Framing of Projected Price Movement
Some technical analysis literature references a general concept sometimes called a “measuring” framework, in which the size of the preceding flagpole is discussed in relation to the magnitude of a subsequent move. This is presented in educational materials as a conceptual observation about how the two phases of the formation may relate to each other, rather than as a specific projection or recommendation.
Indicators Commonly Referenced Alongside Pennant Discussions
While price structure is the central focus of this formation, several other technical analysis tools are frequently mentioned in broader discussions:
- RSI is sometimes referenced in discussions of overbought or oversold territory.
- MACD is occasionally mentioned in relation to crossover signals.
- Bollinger Bands are sometimes referenced in connection with periods of narrowing volatility, sometimes described as a “squeeze.”
These indicators are typically presented as additional layers of context within broader technical analysis discussions, rather than as confirmation tools specific to this formation.
Advanced Pennant Analysis and Discussion Considerations
This section covers additional concepts sometimes referenced alongside this formation in technical analysis commentary.
Discussion of “Fakeouts” in Technical Analysis Literature
A commonly discussed concept in technical analysis more broadly is the “fakeout,” referring to instances where price moves briefly beyond a trendline before reversing direction. Volume is sometimes referenced in such discussions as one of several factors analysts consider, alongside observing whether a previously broken trendline appears to behave differently afterward. This concept is often raised as an example of the general uncertainty inherent in interpreting chart patterns.
Pennant Formations in the Context of Broader Trend Discussion
Technical analysis literature often emphasizes that isolated formations are generally discussed alongside the broader trend context in which they appear. Commentary frequently notes that the relationship between a formation and the prevailing trend on other timeframes is considered relevant to how the formation is interpreted, with formations that run counter to a dominant trend sometimes associated with greater uncertainty in commentary.
Fibonacci Retracement References in Pennant Discussions
Some technical analysis commentary associates the consolidation phase of this formation with proximity to commonly referenced Fibonacci retracement levels, such as 38.2% or 50% of the flagpole’s range. This is generally described as one of several observations sometimes noted in pattern discussions, rather than as a rule with predictive value.
Moving Averages in General Trend Discussion
Moving averages, such as 20-period or 50-period Exponential Moving Averages, are commonly referenced tools in technical analysis discussions generally. Some commentary associates price remaining on one side of a moving average with the broader trend context represented by the flagpole, though this is discussed descriptively as one of many observational tools rather than as a standalone basis for interpretation.
General Discussion of Pattern Reliability

It’s widely acknowledged in technical analysis literature that chart formations, including pennants, do not always develop in line with the structure commentary describes.
Factors Associated With Formations Not Developing as Described
Several factors are commonly cited in discussions of why a chart formation may not continue along the lines its structure might suggest:
- Unexpected economic news can shift price activity independent of chart structure.
- The preceding flagpole move may already reflect most of the available market participation.
- Reduced volume during a later phase is sometimes associated with weaker follow-through.
- Formations identified in choppier or less trending conditions are sometimes described as less consistent with the textbook structure.
General Commentary on Statistical Discussions of This Pattern
Some published market commentary references historical statistics associated with continuation formations of this type, though such figures vary considerably between sources, asset classes, and time periods, and are generally presented as illustrative observations rather than as predictive measures. Readers are commonly encouraged in such literature to treat any cited figures with caution, since past observations are not considered indicative of future market behavior.
General Risk-Related Themes Discussed in Connection With This Pattern
Risk management is widely discussed as a broad topic within trading and investing literature, generally treated separately from any single chart pattern. Commentary in this area sometimes references concepts such as account-level exposure or the relationship between formation size and broader portfolio considerations, typically framed as conceptual material in educational resources rather than as specific numerical guidance.
Common Themes in Discussions of Formation Interpretation Errors
Some frequently cited themes in broader market commentary involve psychological factors, such as reacting impulsively to price movement, sometimes referred to in commentary as “FOMO.” Another commonly discussed theme is the relevance of timeframe context, with commentary noting that a formation observed on a shorter timeframe is sometimes discussed alongside conditions visible on longer timeframes. General commentary also notes that misidentifying a formation where the underlying structure may not clearly be present is a frequently cited source of confusion in pattern-based discussion.
Advantages and Limitations of Technical Analysis Patterns
This section summarizes general characteristics often associated with this type of formation in educational and analytical commentary.
General Discussion of Reward and Risk Framing in Literature
Technical analysis literature sometimes references the general concept of comparing the size of a preceding consolidation phase to the magnitude of subsequent price movement when discussing continuation formations broadly, including pennants. This type of comparison is typically presented in educational materials as a conceptual framework for understanding formation structure, rather than as a specific projection, recommendation, or performance claim.
Conditions Sometimes Associated With Reduced Pattern Clarity
In environments described as low-volatility or “flat,” chart formations, including pennants, are sometimes discussed in technical literature as less consistent with their typical textbook structure. Higher-momentum conditions are more frequently associated in commentary with the formation appearing in line with its commonly described characteristics, while narrower, choppier conditions are sometimes associated with less clearly defined boundaries.
FAQ
What is generally said about the reliability of the pennant pattern?
Reliability is a frequently discussed but widely debated topic in technical analysis commentary. Some sources reference historical observations suggesting this formation has, in certain studied periods and markets, been associated with continuation of the prior trend, though such figures vary by source, market, and time period and are not considered predictive of future outcomes. Broader market conditions, prevailing sentiment, and concurrent news events are commonly cited in this literature as factors that can influence how any individual formation develops.
Can pennant-like shapes appear during sideways markets?
Triangular shapes can visually appear during range-bound conditions, though such shapes are often distinguished in technical analysis literature from a true pennant formation unless they are preceded by a sharp, pronounced flagpole move. In flatter market conditions, similar-looking shapes are more commonly categorized in such discussions as standard symmetrical triangles without a clear directional bias, and commentary often notes that treating these shapes as equivalent to a pennant in non-trending conditions is associated with a higher likelihood of misinterpretation.
What timeframes are most often referenced in discussions of pennant pattern analysis?
Hourly, four-hour, and daily charts are frequently referenced in technical analysis commentary discussing this formation, with longer timeframes generally associated in such discussions with reduced short-term noise. The formation is described in this literature as appearing across many timeframes, though shorter intervals are sometimes discussed alongside considerations such as increased volatility around scheduled economic data releases.
How is a bearish pennant breakout generally described?
A bearish pennant is generally described in technical analysis commentary as following a pronounced downward price move, followed by a narrowing, slightly upward-sloping consolidation phase. Such commentary typically describes a subsequent move beyond the lower boundary of the triangle as commonly associated with continuation of the prior downward trend, though this association is presented descriptively, with outcomes generally discussed as uncertain rather than assured.
Is the pennant pattern considered accessible for those newer to chart analysis?
This formation is sometimes described in educational material as relatively easy to visually identify due to its clear structural components. However, common challenges referenced in such discussions for newer market participants include impatience with how chart patterns unfold, a tendency to identify formations where the underlying structure may not clearly support that classification, and general uncertainty around how a formation may develop over time. Continued study of risk-related concepts in general is widely described in educational literature as a relevant factor in building broader familiarity with chart pattern analysis.


