


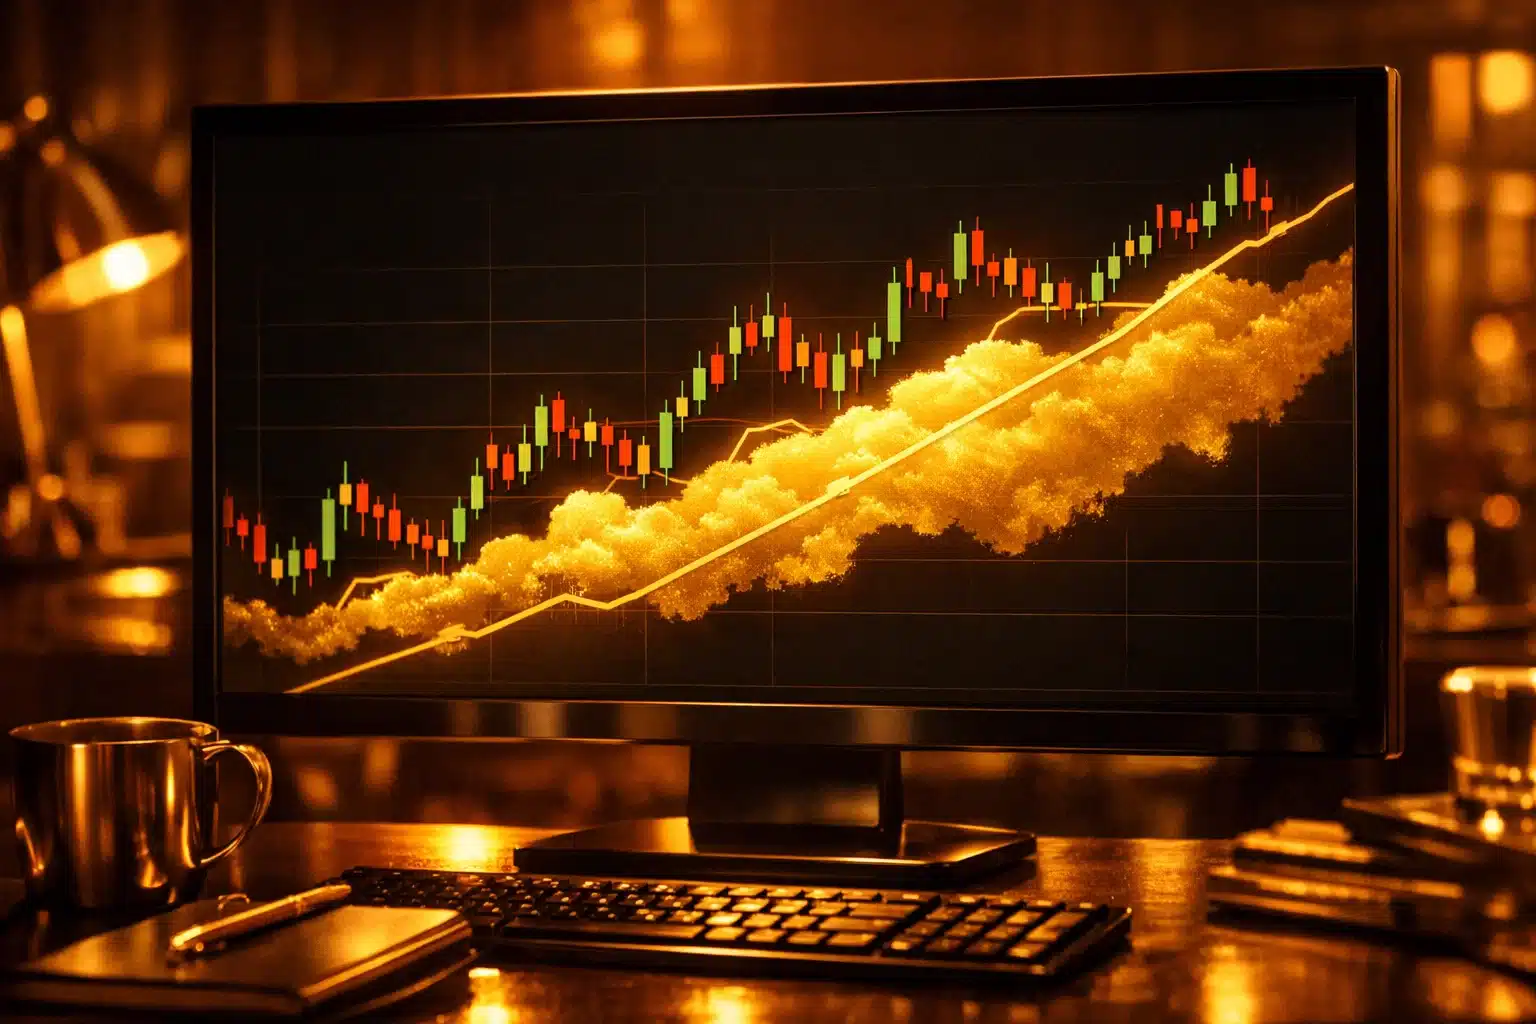
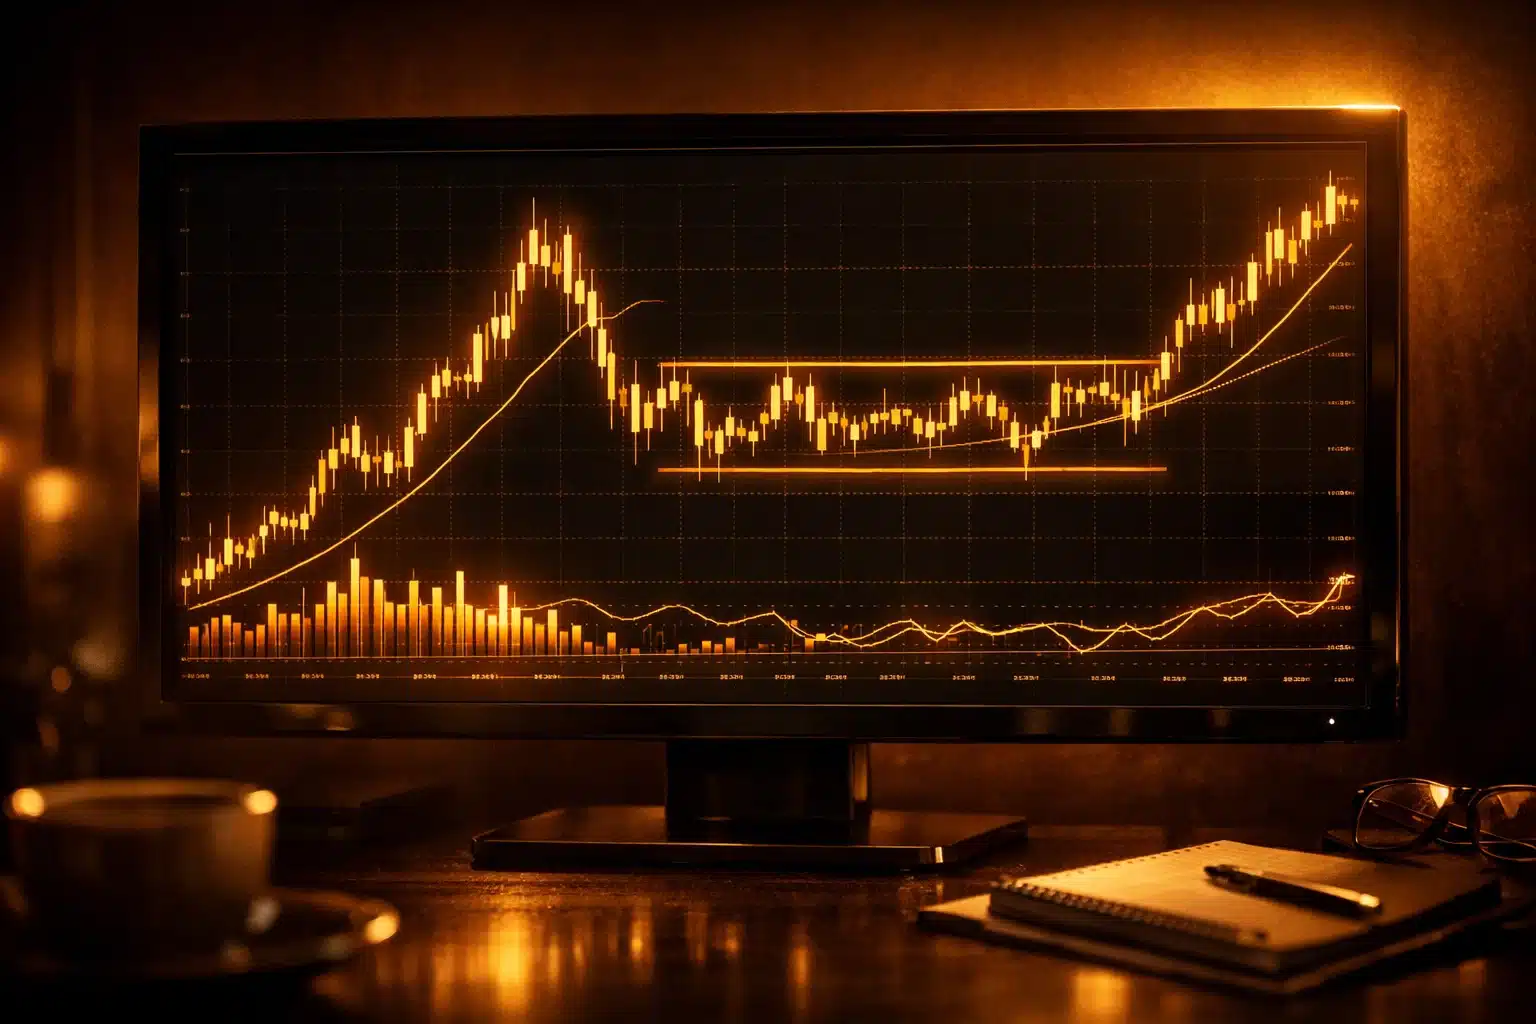
Financial markets generate large volumes of price data, which can make analysis difficult for traders. To help organize this information, many market participants reference a comprehensive indicator known as the Ichimoku Cloud.
This indicator was developed in the late 1930s by Japanese journalist Goichi Hosoda. It was designed to provide a single, consolidated view of trend, momentum, and price levels. Although it may look complex on a chart, the Ichimoku Cloud is generally described as a multi-component framework rather than a single line.
This article covers the structure, calculation, and general interpretation of the Ichimoku Cloud as an educational reference.
Ichimoku Cloud Explained: How This Technical Indicator Works

The Ichimoku Cloud is plotted directly on a price chart. Unlike basic moving averages, which only summarize past price data, several of its components are projected forward, which is sometimes described as a distinguishing feature of the system.
Definition and Core Concept
The term “Ichimoku kinko hyo” is often translated as “one-look equilibrium chart.” This name reflects the indicator’s design intent: presenting trend and price-level information in a single visual.
The indicator is commonly associated with measuring momentum and identifying historical areas of support and resistance. It is sometimes described as differing from standard moving averages because its calculations reference the midpoint of a price range rather than only the closing price.
Visual Representation on Trading Charts
The indicator displays five lines along with a shaded area known as the Kumo, or cloud. Two of the lines forming the cloud’s boundaries are projected 26 periods ahead of current price, which is a structural characteristic frequently noted in descriptions of the system.
Five-Line Structure
The Ichimoku system is composed of five components:
- Tenkan-sen (Conversion Line)
- Kijun-sen (Base Line)
- Senkou Span A (Leading Span A)
- Senkou Span B (Leading Span B)
- Chikou Span (Lagging Span)
These components are generally described as working together, with the relationship between the conversion line and base line associated with shorter-term price behavior, while the cloud itself is more often referenced in discussions of longer-term trend context.
Market Suitability and Timeframe Characteristics
The Ichimoku Cloud can technically be applied across various markets, including equities, foreign exchange, and commodities. It is typically categorized as a trend-following tool, and some analysts note that its lines may flatten and produce conflicting readings in range-bound conditions. The indicator is also sometimes discussed in the context of longer timeframes, such as daily or weekly charts, where price noise is comparatively reduced.
| Timeframe | Common Classification | Noted Characteristic |
|---|---|---|
| 1-Minute to 15-Minute | Short-term/intraday | Frequently described as high noise |
| 1-Hour to 4-Hour | Medium-term | Mixed reliability often cited |
| Daily | Trend-oriented | Commonly referenced as more stable |
| Weekly | Long-term | Often described as the most stable view |
Components of the Ichimoku Cloud and Their Roles
Each line within the Ichimoku system serves a distinct descriptive function. Understanding these roles is generally considered useful before examining the indicator’s calculations.
Conversion Line (Tenkan-sen)
The conversion line is the fastest-moving of the five components. It is generally categorized as a short-term reference point, and a steeper slope is sometimes associated with stronger short-term price movement.
Base Line (Kijun-sen)
The base line reflects a longer averaging period than the conversion line and is often described as a more stable reference point. Some market commentary associates price crossing this line with a potential shift in underlying conditions, though such observations are descriptive rather than predictive.
Leading Span A (Senkou Span A)
Senkou Span A forms one boundary of the cloud. It is calculated from the average of the conversion line and base line, then projected 26 periods forward. Because it draws on shorter-term inputs, it is often described as the more reactive of the two cloud boundaries.
Leading Span B (Senkou Span B)
Senkou Span B forms the other boundary of the cloud. It is calculated using the highest high and lowest low over a 52-period window, also projected forward. Due to its longer lookback period, it is generally described as the slower-moving and more stable boundary.
Chikou Span (Lagging Span)
The Chikou Span plots the current closing price 26 periods in the past. It is typically discussed as a way to compare present price levels with historical price action, rather than as a forward-looking element.
Calculating the Ichimoku Cloud Components
While most charting platforms calculate these values automatically, reviewing the underlying formulas is commonly described as useful for understanding what the indicator represents. All components are derived from the midpoint of a price range.
- Tenkan-sen: (9-period high + 9-period low) / 2
- Kijun-sen: (26-period high + 26-period low) / 2
- Senkou Span A: (Tenkan-sen + Kijun-sen) / 2, plotted 26 periods ahead
- Senkou Span B: (52-period high + 52-period low) / 2, plotted 26 periods ahead
- Chikou Span: current closing price, plotted 26 periods in the past
The space between Senkou Span A and Senkou Span B forms the shaded cloud area. The relative position of these two lines is generally what determines the cloud’s shading on most charting platforms.
Interpreting the Ichimoku Cloud Conceptually
Reading the Ichimoku Cloud generally involves observing the position of price relative to the shaded area, along with the relationship between the indicator’s other components.
Price Position Relative to the Cloud
Some general observations associated with this indicator include:
- Price positioned above the cloud is commonly associated with an upward trend classification.
- Price positioned below the cloud is commonly associated with a downward trend classification.
- Price positioned within the cloud is often described as reflecting a transitional or consolidating phase.
Dynamic Support and Resistance Concepts
The cloud’s boundaries shift over time rather than remaining fixed, which is often cited as a distinguishing feature compared to static horizontal reference lines. A thicker cloud is generally associated with a wider historical price range, while a thinner cloud is sometimes discussed in relation to lower historical price dispersion.
Cloud Thickness and Volatility Context
The width of the Kumo is generally described as reflecting historical price range over the lookback periods used in its calculation. A wider cloud reflects a broader historical range, while a narrower cloud reflects a tighter one. These observations are descriptive characteristics of past price behavior rather than indications of future direction.
Conversion Line and Base Line Relationships
The relationship between the conversion line and the base line is one of the more frequently discussed aspects of the Ichimoku system. A crossing of these two lines is commonly referenced as a point of interest in technical analysis discussions, broadly comparable to how moving-average crossovers are discussed in other contexts.
Some technical commentary categorizes these crossings by their position relative to the cloud: a crossing where the conversion line moves above the base line while price sits above the cloud is sometimes grouped under bullish classifications, while the inverse configuration, conversion line below base line with price below the cloud, is sometimes grouped under bearish classifications. These are descriptive labels used in technical analysis literature rather than directives, and their reliability is generally discussed as variable depending on broader market context.
Price Movement Relative to the Cloud
Price moving from inside the cloud to outside it is one of the more commonly discussed patterns in Ichimoku-related commentary, sometimes referred to as a cloud breakout. Analysts who discuss this pattern often note that its reliability is considered inconsistent, and that false or short-lived breakouts are a recognized characteristic of the indicator. Some commentary associates a breakout occurring alongside a particular cloud color, or alongside the Chikou Span being clear of historical price, with a more frequently cited (though not guaranteed) pattern.
The Chikou Span as a Reference Point
The Chikou Span, being a plot of the current close relative to price from 26 periods earlier, is often described in technical analysis material as an additional reference point used alongside the other components. Some commentary frames it as a way of comparing present price levels against a prior point in the chart’s history, with the line’s position relative to historical price candles cited as one factor among several that analysts may consider together.
Advantages and Limitations of Using the Ichimoku
No technical indicator is considered complete on its own, and the Ichimoku Cloud is generally discussed alongside both its strengths and its constraints.
Commonly Cited Advantages
- Consolidates trend, momentum, and price-level information into a single visual framework.
- May reduce the need to reference multiple separate indicators simultaneously.
- The forward-projected components are sometimes described as a distinguishing structural feature.
- The base line is occasionally referenced in discussions of trailing price-level context.
Commonly Cited Limitations
- The indicator’s components rely on historical highs and lows, which is why it is generally classified as a lagging tool.
- In fast-moving conditions, some analysts note that lagging indicators may not reflect new information as quickly as price itself.
- In range-bound or sideways conditions, the lines may cluster together, which some commentary associates with reduced clarity in the indicator’s readings.
- As with any single tool, relying solely on one indicator is generally described in educational material as a limitation rather than a complete analytical approach.
Frequently Asked Questions
Is the Ichimoku Cloud associated with a particular timeframe?
The indicator was originally developed with daily charts in mind. It is also referenced across other timeframes, including shorter intervals, although discussions of the indicator often note that shorter timeframes are associated with greater price noise.
Why does the cloud appear in different colors?
The shading is determined by the relative position of Senkou Span A and Senkou Span B. When Span A is above Span B, the cloud is typically shaded one color on most platforms; when Span B is above Span A, it is typically shaded another. This is a calculation-based visual convention rather than a signal in itself.
Is the Ichimoku Cloud referenced in cryptocurrency markets?
The indicator is applied across various asset classes, including digital assets, since its calculations are not specific to any one market. Some commentary notes that certain users adjust the standard period settings when applying the indicator to markets that trade continuously, although the original parameters remain commonly referenced.
What do the default settings (9, 26, 52) represent?
These values were originally selected by Goichi Hosoda and are linked to the historical structure of the Japanese business week during that period. Despite changes in standard trading-week conventions since then, these parameters remain the most commonly referenced default settings for this indicator.


