


Retracement analysis remains one of the most widely applied technical analysis tools among forex traders, offering a mathematical approach to identifying potential support and resistance levels. These horizontal lines, derived from a specific numerical sequence, help traders anticipate where price movements may pause or reverse during market corrections. Understanding how to properly apply this method can significantly enhance your trading strategy when combined with sound risk management and complementary indicators.
Understanding Fibonacci Retracements: The Foundation
The retracement tool operates on a principle observed across financial markets: after substantial price movements, markets typically retrace a predictable portion before continuing their original trajectory. This phenomenon isn’t mystical—it reflects the collective behavior of market participants responding to psychological price levels and profit-taking patterns.
The underlying sequence—a series of numbers where each value equals the sum of the two preceding ones (0, 1, 1, 2, 3, 5, 8, 13, 21…)—produces ratios that appear throughout nature and financial markets. When you divide any number by the next number in this sequence, you approach 0.618, known as the golden ratio. This ratio, along with its inverse (1.618) and related calculations, forms the basis of these retracement levels.
The Key Fibonacci Levels
Traders focus on five primary levels when using this technique:
- 23.6% – The shallowest retracement, indicating strong momentum
- 38.2% – A common level for mild corrections in robust trends
- 50% – While not technically derived from the sequence, historical data suggests this psychological level frequently acts as support or resistance
- 61.8% – The golden ratio, considered the most significant level
- 78.6% – The deepest retracement before trend invalidation becomes likely
The 61.8% level deserves particular attention. In trending markets, price action that holds above this threshold during pullbacks often signals continuation strength, making it a critical decision point for position entries.
Step-by-Step: How to Apply Fibonacci Retracements
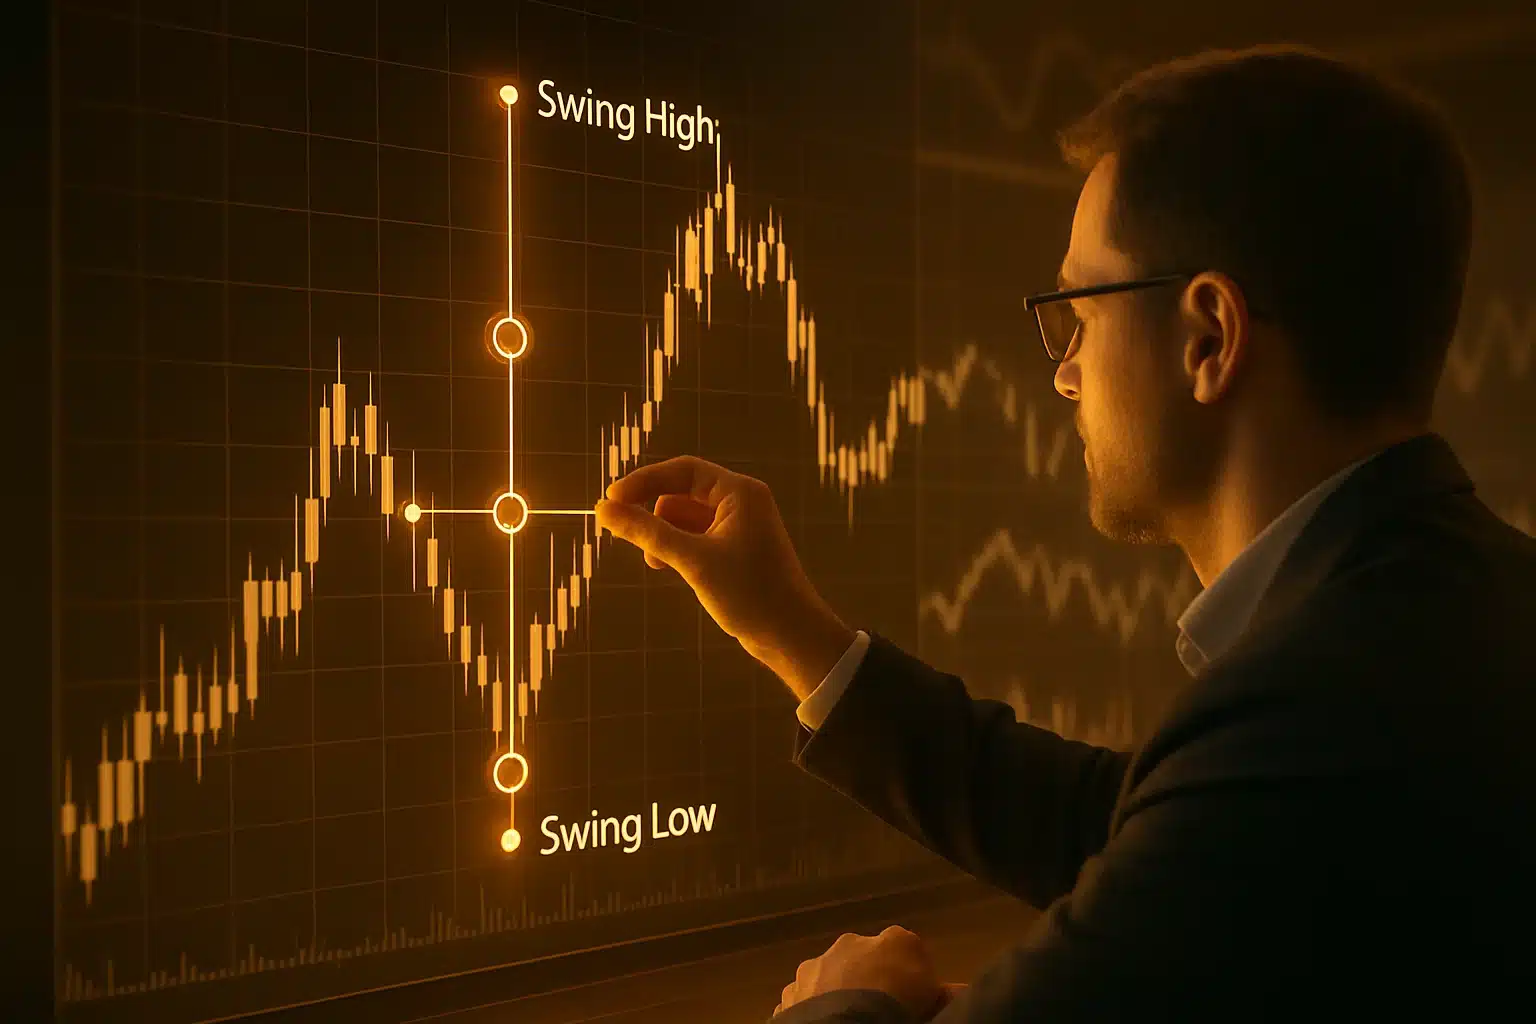
Step 1: Identify Significant Swing Points
Effective use of the tool begins with selecting appropriate reference points. Look for clear, established trends with distinct highs and lows—not minor fluctuations that lack meaningful market structure. On daily or 4-hour charts, these swing points represent substantial price moves that captured trader attention and created momentum.
A common error involves drawing retracements across insufficient price data. Your selected swing should represent a completed impulse move where the trend has clearly paused or reversed direction, not a move still actively developing.
Step 2: Draw the Fibonacci Retracement Tool Correctly
Most trading platforms, including those offered by INFINOX, provide integrated tools for this analysis. The drawing direction matters:
For an uptrend: Select the tool and click first on the swing low (the starting point of the upward movement), then drag to the swing high (the peak). The display shows 0% at the high and 100% at the low, with retracement levels appearing between them.
For a downtrend: Click first on the swing high (the peak before decline), then drag down to the swing low (the bottom). This inverts the display, placing 0% at the bottom and 100% at the top.
Maintain consistency in your reference points. If you use candlestick wicks (the highest/lowest points including shadows) in one analysis, continue using wicks across all applications. Switching between wicks and closing prices creates inconsistent levels that undermine accuracy.
Step 3: Interpret the Fibonacci Levels
Once drawn, the tool automatically calculates potential support and resistance levels. These horizontal lines represent zones where price may encounter buying or selling pressure. Treat these as areas of interest rather than precise price points—markets rarely reverse at exact numbers.
Monitor how price action responds as it approaches each level. Does it slow down? Do candlestick patterns emerge? Is volume changing? These observations provide context beyond the mathematical lines themselves.
Fibonacci Trading Strategies for Forex Markets
Entry Points in Uptrend Scenarios
When markets establish an uptrend, pullbacks to key levels create opportunities for traders who missed the initial move. The 38.2% and 61.8% thresholds function as primary support zones where buyers may re-enter.
Consider this approach: After a currency pair rallies from 1.2000 to 1.2500, calculate the retracement levels. If price retraces to the 61.8% zone at approximately 1.2191 and begins forming bullish candlestick patterns while volume increases, this confluence suggests a high-probability long entry. Place your stop-loss below the 78.6% level to manage downside risk.
The 50% retracement deserves attention in forex trading, where psychological round numbers influence trader behavior. Currency pairs often find support or resistance near this midpoint, particularly during moderate corrections in strong trends.
Short Positions in Downtrend Markets
During established downtrends, traders use retracements to identify resistance levels for potential short entries. As price retraces upward against the prevailing trend, resistance often emerges at the 38.2% or 61.8% levels.
A systematic approach involves monitoring the first level (23.6%). If price breaks through decisively, the next threshold becomes your focus. Should the 38.2% resistance hold, this presents a short entry opportunity with a stop-loss positioned just above the 50% retracement.
Risk Management with Fibonacci Levels
These mathematical levels provide natural reference points for stop-loss placement. In uptrends, positioning stops slightly below the origin of the measured swing protects capital if the trend fails. As price advances and tests higher levels, you can trail your stop-loss upward, locking in profits while giving trades adequate room to develop.
For take-profit targets, consider using extensions, which project levels beyond the original swing. Common extension levels include 127.2%, 161.8%, and 261.8%, offering logical exit points for trend-following positions.
Combining Fibonacci Retracements with Other Technical Indicators
MACD and Fibonacci Confluence
The Moving Average Convergence Divergence (MACD) indicator becomes significantly more powerful when aligned with retracement levels. Look for MACD crossovers occurring near these zones—bullish crossovers at the 61.8% support level or bearish crossovers at resistance create high-probability setups.
MACD divergence at these key levels provides particularly strong signals. If price makes a lower low while MACD makes a higher low, and this divergence occurs precisely at the 61.8% threshold, the convergence of these factors suggests an elevated probability of reversal.
Trend Lines and Fibonacci Intersections
When a trend line intersects with a retracement level, technical analysis suggests this zone possesses enhanced significance. The mathematical precision of these ratios combined with the visual market structure represented by trend lines creates what traders call “confluence”—multiple independent factors supporting the same price zone.
Draw your trend lines connecting significant swing lows in uptrends or swing highs in downtrends. If a trend line touches price at the exact location of a 61.8% level, this intersection warrants close attention as a potential reversal or continuation point.
Candlestick Patterns at Key Fibonacci Levels
Candlestick patterns gain predictive value when they form at retracement levels. A hammer candle appearing at the 61.8% zone during an uptrend pullback, or an evening star pattern at the 61.8% resistance during a downtrend rally, provides visual confirmation that price action is responding to these mathematical zones.
Common reversal patterns to monitor at these levels include:
- Hammer and inverted hammer at support levels
- Shooting star and hanging man at resistance levels
- Engulfing patterns showing momentum shifts
- Doji candles indicating indecision at critical levels
RSI and Momentum Confirmation
The Relative Strength Index (RSI) complements this analysis by identifying overbought and oversold conditions. When price reaches a retracement level while RSI simultaneously shows extreme readings (below 30 or above 70), the combination suggests potential reversal pressure.
RSI divergence at these key thresholds provides particularly compelling signals. If price touches the 61.8% level during a downtrend while RSI forms a bullish divergence, this dual confirmation supports a countertrend entry with improved risk-reward characteristics.
Common Mistakes When Using Fibonacci Retracement Tools

Inconsistent Reference Point Selection
One critical error undermines many applications: switching between candlestick wicks and closing prices when drawing retracements. This inconsistency produces unreliable levels that misrepresent true ratios relative to market structure.
Develop a systematic approach and maintain it across all analyses. If you use wicks to identify swing extremes on EUR/USD, continue using wicks for GBP/USD, USD/JPY, and all other pairs. This consistency ensures your levels reflect genuine mathematical relationships within price data.
Applying Fibonacci to Inappropriate Timeframes
This tool works most reliably on timeframes of one hour and above. On 5-minute or 15-minute charts, market noise and random volatility create false signals that reduce effectiveness. The mathematical precision of these ratios requires sufficient price data to produce meaningful support and resistance levels.
For intraday forex trading, use 1-hour or 4-hour charts as your primary timeframes for analysis. Daily and weekly charts provide even stronger levels for swing trading and position trading strategies.
Drawing Retracements on Insignificant Price Swings
Not every price movement warrants this type of analysis. Select only significant swings that represent clear trend development—moves that other market participants obviously noticed and traded. Minor fluctuations produce levels with little predictive value because they lack market significance.
A useful guideline: if you’re questioning whether a swing is significant enough for analysis, it probably isn’t. Choose obvious, clean trends where the direction and magnitude are unmistakable.
Using Fibonacci in Isolation
Perhaps the most significant limitation is occasional failure when used alone. These levels represent zones where price may react—not guarantees of reversals. Always combine this approach with additional technical analysis tools, including support and resistance levels from previous price action, volume analysis, and momentum indicators.
Treat these mathematical zones as areas of interest that require confirmation before trading. Wait for price action, candlestick patterns, or indicator signals that verify the level is actually influencing market behavior before committing capital.
Chart Clutter from Multiple Fibonacci Drawings
Applying this tool across multiple timeframes on a single chart creates visual confusion. While multi-timeframe analysis provides value, overlay too many grids and you’ll struggle to distinguish which levels matter most.
Instead, analyze levels on different timeframes separately, noting which align across multiple timeframes. These confluent zones—where, for example, the daily 61.8% level coincides with the 4-hour 50% level—deserve priority attention in your trading decisions.
Practical Fibonacci Retracement Example in Forex
Consider a real-world scenario: EUR/USD rallies from 1.0800 to 1.1300, representing a 500-pip movement. You anticipate a retracement and want to identify potential support levels using this mathematical approach.
Apply the tool from the swing low (1.0800) to the swing high (1.1300). The key levels calculate as follows:
| Level | Price Calculation | Resulting Price |
|---|---|---|
| 23.6% | 1.1300 – (500 × 0.236) = 1.1300 – 118 | 1.1182 |
| 38.2% | 1.1300 – (500 × 0.382) = 1.1300 – 191 | 1.1109 |
| 50.0% | 1.1300 – (500 × 0.500) = 1.1300 – 250 | 1.1050 |
| 61.8% | 1.1300 – (500 × 0.618) = 1.1300 – 309 | 1.0991 |
| 78.6% | 1.1300 – (500 × 0.786) = 1.1300 – 393 | 1.0907 |
As price begins retracing from 1.1300, monitor these levels. If EUR/USD drops to 1.1109 (the 38.2% level) and forms a bullish engulfing pattern while RSI shows oversold conditions, this confluence of factors suggests a potential long entry. Place your stop-loss at 1.1050 (just below the 50% level) and target a move back toward the 1.1300 high.
Should price break below 1.1109, the next threshold at 1.1050 becomes your focus. A break below 1.0991 (the 61.8% golden ratio level) would suggest the uptrend may be weakening, prompting reassessment of your bullish bias.
Advanced Fibonacci Techniques for Experienced Traders
Fibonacci Extensions for Price Targets
While retracements help identify entry points during corrections, extensions project potential targets once the trend resumes. After price retraces to a key level and resumes its original direction, extension levels at 127.2%, 161.8%, and 261.8% provide logical profit-taking zones.
To apply extensions, use three points: the swing low, swing high, and the retracement low (in uptrends). The extension levels then project beyond the original high, indicating where the next impulse wave might terminate.
Multiple Fibonacci Analysis Across Timeframes
Professional traders often identify “clusters”—price zones where levels from different timeframes converge. If the daily chart’s 61.8% retracement aligns with the 4-hour chart’s 50% level, this confluence creates a stronger potential support or resistance zone than either level in isolation.
This multi-timeframe approach requires discipline: analyze longer timeframes first to establish the primary trend and key levels, then zoom into shorter timeframes to refine entry timing within those zones.
Combining Fibonacci Retracements and Extensions
Advanced strategies involve using both tools simultaneously. During an uptrend, identify retracement levels for entries, then project extension levels for exits. This comprehensive framework provides a complete trade plan from entry through risk management to profit targets.
Fibonacci Retracements in Different Market Conditions
Trending Markets
This technique performs optimally in clearly trending markets where corrections occur within the context of sustained directional movement. In strong uptrends, the 38.2% and 50% levels often provide sufficient support for continuation. Deeper retracements to 61.8% may indicate weakening momentum worth monitoring.
During trending market conditions, price frequently respects multiple levels sequentially. An initial bounce from 38.2% followed by a subsequent test of 50% creates a pattern you can anticipate and trade systematically.
Range-Bound Markets
In ranging or consolidating markets, retracements offer less predictive value. When price lacks clear directional momentum, the mathematical precision of these ratios loses its relevance because market participants aren’t responding to trend dynamics.
Before applying the tool, ensure a genuine trend exists. If price action shows no clear higher highs and higher lows (uptrend) or lower highs and lower lows (downtrend), consider alternative technical analysis approaches better suited to range-bound conditions.
High Volatility Environments
During periods of elevated volatility—such as major economic announcements or geopolitical events—these mathematical levels may be violated quickly as emotional trading overwhelms technical considerations. In these environments, widen your stop-losses and require stronger confirmation signals before entering positions.
Conversely, in low volatility conditions, these levels often prove remarkably accurate as algorithmic traders and technical systems respond precisely to mathematical zones without emotional interference.
Fibonacci Retracement Quick Reference Guide
Understanding how a trader can use these mathematical levels effectively requires knowing when retracement levels are most effective and how to combine them with other technical tools. The table below provides a practical comparison to help traders discover how to use this technique across different scenarios.
| Market Condition | Best Levels to Use | Confirmation Signals | Risk Management Strategy |
|---|---|---|---|
| Strong Uptrend | 38.2%, 50% as level of support | MACD bullish crossover, bullish candlesticks | Stop-loss below 61.8% level |
| Moderate Uptrend | 50%, 61.8% as key support and resistance levels | RSI oversold + trend line confluence | Stop-loss below 78.6% level |
| Strong Downtrend | 38.2%, 50% as resistance levels | MACD bearish crossover, bearish patterns | Stop-loss above 61.8% level |
| Moderate Downtrend | 50%, 61.8% as support or resistance levels | Volume spike + candlestick reversal | Stop-loss above 78.6% level |
| Consolidation | Avoid or use 50% as potential level only | Wait for breakout confirmation | Wider stops due to uncertainty |
This comparison demonstrates how these horizontal retracement lines are used differently depending on market strength. The tool can help traders identify these levels of support or resistance, but combining this method with price action confirmation significantly improves trading outcomes. Remember that these levels are based on the mathematical sequence discovered by Leonardo Fibonacci, and they help traders anticipate where price might pause or reverse.
Key Takeaways for Implementing Fibonacci Retracements
Successful application requires understanding strengths and limitations. These tools excel at identifying potential support and resistance levels where price action may pause, but they cannot predict market behavior with certainty. Your effectiveness improves when you:
- Maintain consistency in how you select swing points and whether you use wicks or closing prices. This standardization ensures your levels accurately reflect mathematical ratios within the price structure.
- Use appropriate timeframes of one hour and above to filter market noise and identify levels with genuine significance. Daily and weekly charts provide the strongest thresholds for position traders.
- Combine with complementary indicators such as MACD, RSI, trend lines, and candlestick patterns. Confluence between these mathematical levels and other technical factors creates higher-probability trade setups.
- Treat levels as zones, not exact prices. Markets react within areas around these ratios, not at precise pip values. Allow room for price to approach and respond to these zones.
- Apply sound risk management by using these levels to place logical stop-losses and take-profit targets. These natural reference points help you manage position sizing and risk-reward ratios effectively.
- Focus on significant price swings that represent clear trends attracting market attention. Avoid drawing retracements on minor fluctuations lacking structural significance.
- This approach remains a valuable component of comprehensive technical analysis when applied with discipline and realistic expectations. As you develop proficiency with the tool, you’ll recognize patterns in how markets respond to these levels, enabling more confident trading decisions across the forex market and beyond.
Frequently Asked Questions About Fibonacci Retracement in Forex Trading
What is a Fibonacci retracement and how does it work?
A retracement tool based on the mathematical sequence is a technical analysis method that uses horizontal lines to identify possible support and resistance levels where price may reverse during a correction. Based on the sequence discovered by Leonardo Fibonacci, these levels are considered key because they reflect natural mathematical ratios that appear throughout financial markets. When you plot these retracements on a chart, the tool automatically calculates percentage levels at 23.6%, 38.2%, 50%, 61.8%, and 78.6%. These lines mark potential zones where traders can anticipate price reactions, making them valuable for timing entries and exits in trending markets.
How do I learn how to use the Fibonacci retracement tool correctly?
To use the tool effectively, start by identifying a significant price swing with clear high and low points. Select it from your trading platform and draw the retracement from the swing low to swing high in an uptrend, or from swing high to swing low in a downtrend. The levels can help you identify where price might find support or resistance during pullbacks. The most important principle is consistency—always use the same reference points (either wicks or closing prices) when you draw the retracement. Practice on historical charts first to understand how these levels are used before applying them to live trading. Combining this approach with candlestick patterns and momentum indicators provides stronger confirmation signals.
Which Fibonacci retracement levels are most important for trading?
The 38.2%, 50%, and 61.8% levels are considered the most significant thresholds for trading decisions. The 61.8% level, derived from the golden ratio, is particularly powerful as one of the levels that frequently acts as a strong level of support in uptrends or resistance in downtrends. These key levels help traders identify where institutional buying or selling pressure may emerge. In strong trends, price often bounces from the 38.2% level, while deeper corrections test the 61.8% threshold. When you use these retracement levels in conjunction with other technical analysis tools, these key support and resistance levels become even more reliable for entry and exit decisions.
Can I use Fibonacci retracements and extensions together?
Yes, combining retracements with extensions creates a comprehensive trading framework. Use retracements to identify entry points during corrections, then use extensions to project profit targets once the trend resumes. Retracement levels can be used to find where price might pause during pullbacks, while extension levels (127.2%, 161.8%, 261.8%) indicate where the next impulse wave might terminate. This approach allows a trader to use both tools strategically—the retracement tool can help traders time their entries, while extensions help establish realistic take-profit zones. This combination of tools based on the mathematical sequence provides a complete trade management strategy from entry to exit.
Why do Fibonacci retracement levels sometimes fail?
These mathematical levels are not guarantees—they represent possible support and resistance levels where price may react, not certainties. Retracement levels are most effective in clear trending markets with strong momentum; they become unreliable in ranging or highly volatile conditions. One limitation is that this technique works best when multiple confirming factors align—using it in isolation without considering volume, candlestick patterns, or momentum indicators reduces accuracy. Additionally, if you incorrectly identify swing points or use these levels on short timeframes (below 1-hour charts), the levels of support and resistance become less meaningful. The tool can help traders, but only when applied correctly within a broader technical analysis framework.
How do I combine Fibonacci levels with other technical indicators?
The most effective approach to combining this method involves identifying confluence zones where multiple technical factors align. Look for situations where a retracement level coincides with a trend line, previous support or resistance zone, or a round number. Adding momentum indicators like MACD or RSI provides confirmation—for example, when price reaches the 61.8% retracement line while RSI shows oversold conditions, this dual signal strengthens the setup. Candlestick patterns forming at one of these key levels offer visual confirmation that price is respecting these zones. This multi-layered approach, based on mathematical ratios combined with price action and indicator confirmation, significantly improves the reliability of your trading signals and helps you use these levels more effectively in real market conditions.


