

Success in the financial markets often depends on your ability to interpret the silent language of price action. Among the various tools available to technical analysts, certain chart formations stand out as some of the most reliable indicators of impending market shifts. Whether you are navigating the volatile forex market or looking for entries in blue-chip stocks, identifying these shapes can significantly sharpen your edge.
What is Wedge Pattern in Technical Analysis?
A wedge pattern is a technical analysis formation characterized by contracting price ranges that converge over time. As a trader, you will notice that the price is carved into a tightening corridor, created by two slanted trendlines that move in the same direction—either both upward or both downward. Unlike a triangle pattern, where trendlines often move in opposite directions, this figure shows a clear, albeit weakening, directional bias.
Characteristics and Key Features of Wedge Formation
The formation of a technical setup requires several specific criteria to be considered valid for a trading strategy. First, you must identify at least five touches of the trendlines—three on one side and two on the other—to confirm the lines are respected by the market. The shape is defined by its convergence; the distance between the support and resistance lines must decrease as the price action progresses. This narrowing movement suggests that the dominant side (bulls or bears) is losing momentum, even as they continue to push the price in their favored direction.
How Wedge Pattern in Technical Analysis Works
A wedge pattern in technical analysis works by illustrating a period of diminishing marginal returns for the prevailing trend. For instance, in a rising formation, buyers are still making new highs, but those highs are becoming progressively shallow. Simultaneously, the lows are rising faster than the highs. This creates a visual representation of exhaustion. When the price finally breaks out of the structure, it often moves with significant velocity because the pent-up pressure from the consolidation is suddenly released.
Importance of Wedge Patterns for Price Prediction
These technical formations offer high predictive value because they represent a transition in market sentiment. Such structures typically indicate that the current trend is struggling to maintain its pace. For professional traders, the pattern is a signal that a significant price movement is on the horizon. By observing the angle of the corridor and the preceding trend, you can anticipate whether the market is preparing for a sharp reversal or a momentary pause before continuing its long-term journey.
Difference Between Wedge and Triangle Patterns
While they may look similar at first glance, the wedge pattern is a technical formation distinct from a standard triangle pattern. In a symmetrical triangle, the trendlines converge from opposite directions. In this chart model, both lines slant in the same direction. Furthermore, triangles are often neutral until a breakout occurs, whereas a narrowing structure usually carries a specific bias based on its slope. A rising formation indicates a potential bearish drop, while a falling version is typically bullish, regardless of the prior trend.
Role of Price Consolidation in Wedge Pattern in a Chart
Price consolidation within the setup serves as a pressure cooker for the market. As the price moves within the formation, the trading range narrows, forcing market participants to make a decision. This consolidation phase is vital because it filters out weak hands and builds the liquidity necessary for a sustained move once the breakout occurs. The more mature the consolidation—meaning the closer the price gets to the apex of the structure—the more explosive the eventual exit tends to be.
Types of Wedge Patterns in Technical Analysis

These price models are categorized by the direction in which they slant. Each type provides a different set of expectations for the trader and requires a specific mindset when looking for trading opportunities.
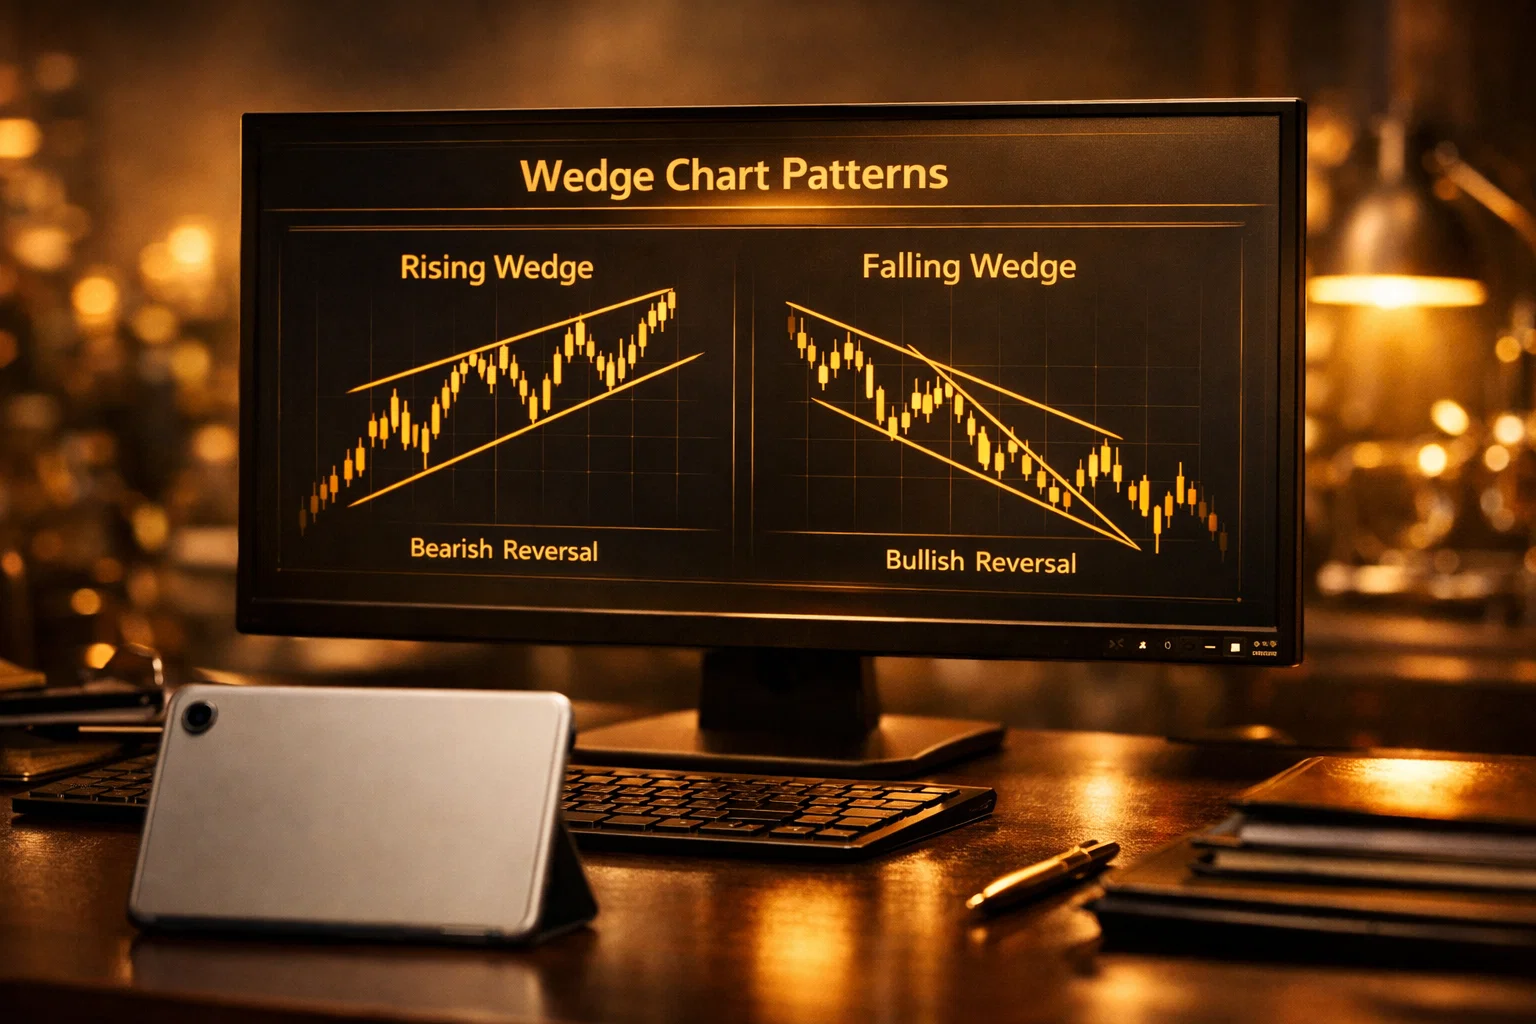
Falling Wedge Pattern: Bullish Reversal and Continuation
The falling wedge is a bullish chart pattern that slants downward against the prevailing trend or as a correction within an uptrend. In this scenario, the falling formation is typically a sign that the bears are losing their grip on the market. As the price falls, the distance between the lower lows and the lower highs shrinks. This falling structure is considered bullish because it suggests that despite the downward price movement, selling pressure is drying up. When the price breaks out of the setup to the upside, it marks a bullish reversal or a continuation of a prior bull market.
Rising Wedge Pattern: Bearish Reversal and Continuation
Conversely, the rising wedge pattern typically indicates a bearish outcome. Even though the price is still rising, the rising formation shows that the bulls are struggling to push the price significantly higher. This upward structure is generally considered bearish because the support line (the lower line) is steeper than the resistance line. This suggests that the momentum is fragile. When the price eventually breaks out of the pattern by falling through the support line, it triggers a bearish reversal or signals that a larger downtrend is resuming.
Ascending Wedge vs Descending Wedge Price Action Dynamics
Understanding the dynamics between an ascending wedge (rising) and a descending wedge (falling) is crucial for accurate trading decisions.
| Feature | Ascending Wedge (Rising) | Descending Wedge (Falling) |
|---|---|---|
| Slope | Upward | Downward |
| Market Bias | Bearish | Bullish |
| Trendline Steepness | Rising support line is steeper | Falling resistance line is steeper |
| Signal Type | Reversal or Continuation | Reversal or Continuation |
| Typical Breakout | Downward | Upward |
Recognizing Falling and Rising Wedge Chart Patterns
To successfully identify the setup, you must look at the relationship between the peaks and troughs. In a rising chart pattern, you are looking for higher highs and higher lows, where the lows are catching up to the highs. In a falling chart model, you are searching for lower lows and lower highs, where the highs are dropping faster than the lows. Recognizing these subtle differences in slope is the key to distinguishing the formation from a simple channel or a pennant.
How to Identify a Wedge Pattern on Live Charts

Identifying these patterns in real-time requires a disciplined approach and a keen eye for detail. The market is often noisy, making it easy to misinterpret random price movement as a valid pattern.
Spotting Converging Trendlines and Support Levels
The first step to identify the price model is to draw your trendlines. You need a clear rising support line and a corresponding rising resistance line for a rising formation. For a falling setup, you need a falling resistance line and a falling support line. Ensure that these lines are clearly converging toward a single point in the future. If the lines are parallel, you are looking at a channel, not a contracting structure.
Volume Requirements for Valid Wedge Chart Patterns
Trading volume is a critical confirmation tool when using these technical signals. Ideally, you should see a decrease in trading activity as the formation forms and the price consolidates. This represents a quiet before the storm. However, when the price finally breaks out of the pattern, a significant spike in volume is necessary to confirm the move’s validity. A breakout on low volume is often a false signal, suggesting the price may soon drift back into the consolidation zone.
Timeframes and Frequency of Pattern Occurrence
These setups form on all timeframes, from one-minute scalping charts to monthly investment charts. However, the reliability of the formation typically increases with the timeframe. A setup on a daily chart is generally considered more authoritative than one on a five-minute chart. These structures occur frequently in trending markets, often acting as the flag or pennant that marks a mid-trend correction.
Automated Tools to Identify a Wedge Pattern
Many modern trading platforms offer automated pattern recognition software. These tools use algorithms to scan thousands of assets to identify the specific shape automatically. While these can be incredibly helpful for finding potential trading opportunities, you should always manually verify the formation to ensure the trendlines are placed logically and that the volume profile supports the trade.
Strategies to Trade Wedge Patterns Effectively
Once a pattern is identified, the focus shifts to execution. Successful trading with these formations requires patience and a strict adherence to your entry criteria.
Identifying Optimal Breakout Direction
While a rising wedge is bearish and a falling wedge is typically bullish, you should never assume the direction until the breakout occurs. The optimal exit direction is the one that breaches the slanted trendline with high volume. For a falling structure, look for a break above the upper resistance. For a rising formation, look for a break below the rising support line.
Entry Point Techniques for Trading with Wedge Patterns
There are two primary ways to enter a trade:
- The Aggressive Entry: Entering the trade the moment the price closes outside the pattern boundary. This ensures you don’t miss the move but increases the risk of being caught in a false breakout.
- The Conservative Entry: Waiting for the price to break out, then return to retest the broken trendline as new support or resistance. Entering on the retest provides a higher probability of success.
Setting Price Targets and Take Profit Levels
The standard method for determining a profit target is based on the height of the formation. You measure the vertical distance between the two trendlines at the start of the setup (the widest part). You then project this distance from the breakout point. For example: Profit Target = Breakout Price + Height of the Model (for a falling version). This provides a clear, objective target for your trading strategies.
How to Trade Wedge Patterns with Divergences
Combining these formations with other indicators like the RSI (Relative Strength Index) can provide a powerful confluence of signals. If you see a rising formation while the RSI is making lower highs, you have a bearish divergence. This suggests that the upward price movement is losing strength and increases the likelihood of a successful bearish trade once the price breaks out of the structure.
Integrating Technical Indicators to Trade Wedge Chart Patterns
To increase your success rate, you should avoid using these patterns in isolation. By combining these formations with other indicators, you can filter out low-probability setups.
Using MACD with Wedge Patterns in Trading
The Moving Average Convergence Divergence (MACD) is excellent for confirming momentum during a formation’s development. If a falling chart model is identified and the MACD histogram begins to move upward or produces a bullish crossover, it reinforces the signal that a reversal or continuation is imminent. This dual confirmation helps in making better trading decisions.
Combining Bollinger Bands for Volatility Confirmation
Bollinger Bands help you identify the volatility surrounding the setup. When a formation forms, the bands typically contract, reflecting the price consolidation. When the price breaks out of the structure and touches or exceeds the outer band, it suggests that the volatility is expanding and that the new trend is likely to be sustained.
Momentum Filters for Rising or Falling Breakouts
Using momentum oscillators like the Stochastic or the Commodity Channel Index (CCI) can act as a filter. For a rising chart pattern, you want to see momentum indicators in overbought territory, starting to turn downward before the price actually breaks the support line. This prepares you for the bearish reversal before the breakout happens.
Risk Management when Trading the Wedge Pattern

Approximately 70-89% of retail investor accounts lose money when trading CFDs and high-leverage products. Therefore, risk management is not optional; it is the foundation of your trading career.
Setting Stop Loss Orders to Protect Capital
The most common place to set a stop loss is on the opposite side of the structure. For a falling trade, place your stop loss just below the most recent swing low within the formation. For a rising setup, place it just above the most recent swing high. This ensures that if the breakout fails and the price returns into the pattern, your losses are contained.
Calculating Risk-to-Reward Ratios for Wedge Setups
Before entering any trade based on these patterns, calculate your risk-to-reward ratio. A healthy ratio is 1 / 2 or higher. Risk-to-Reward Ratio = (Target Price – Entry Price) / (Entry Price – Stop Loss Price). If the potential reward does not significantly outweigh the risk, it is often better to pass on the setup and wait for a cleaner formation.
Common Mistakes and Risks of Wedge Trading
One of the greatest risks when trading these figures is the false breakout. This occurs when the price momentarily leaves the structure but quickly reverses. To avoid this, many professional traders wait for a candle to close outside the pattern or use a filter like a 1% price penetration beyond the trendline. Another mistake is misidentifying a channel as a contracting formation, which leads to incorrect bias.
Managing Volatility During Pattern Formation
Volatility often decreases during the development of the structure and surges during the breakout. You must ensure your trading platform can handle high-volatility execution. Using limit orders instead of market orders can help you avoid slippage during fast-moving market conditions.
Is Wedge a Continuation or Reversal Pattern?
This price model is a unique tool because it can be both a continuation and a reversal pattern. Its classification depends largely on where it appears in relation to the primary trend.
Recognizing Reversal Pattern Signals at Trend Extremes
When a rising formation appears after a prolonged uptrend, it is often a bearish reversal pattern. It suggests that the buyers are exhausted and a major peak is forming. Similarly, a falling formation at the bottom of a long downtrend indicates a bullish reversal. In these cases, the setup signals a change in the long-term direction of the market.
Identifying Wedge a Continuation Signal in Strong Trends
In a strong bull market, a falling structure often appears as a temporary correction or pause. In this context, the setup is a continuation pattern. It suggests that the sellers tried to push the price down but failed to gain momentum, allowing the bulls to regroup. Once the price breaks out to the upside, the original trend resumes.
Impact of Market Trends on Pattern Reliability
The broader market trend acts as a tailwind for your trades. Trading a falling setup in a bullish market has a much higher probability of success than trading one in a secular bear market. As the saying goes, “the trend is your friend,” and using these patterns in alignment with the macro trend is a hallmark of an expert trader.
Advantages and Disadvantages of Wedge Patterns

Every technical tool has its strengths and weaknesses. Understanding these will help you set realistic expectations for your trading performance.
Key Advantages of Wedge Patterns in Trading
These technical formations offer several distinct advantages:
- Precise Entry and Exit Points: The converging trendlines provide clear levels for triggers and stops.
- Favorable Risk-to-Reward: Because the formation narrows, the required stop loss is often small compared to the potential profit target.
- Versatility: They work across all asset classes, including stocks, crypto, and commodities.
- Signal Strength: A confirmed breakout from a long-term structure typically leads to a sustained move.
Common Disadvantages of Wedge Patterns
Despite their benefits, there are several drawbacks to consider:
- Subjectivity: Two different traders might draw the trendlines differently, leading to conflicting signals.
- False Breakouts: The price often whipsaws around the lines before making a decisive move.
- Slow Formation: It can take a long time for the setup to fully form, requiring significant patience.
- Complexity: Distinguishing between a reversal and a continuation setup can be difficult for beginners.
Accuracy and Profitability in Different Asset Classes
Research suggests that these patterns tend to have higher accuracy in high-liquidity markets like major forex pairs and large-cap stocks. In illiquid assets, the pattern is more prone to manipulation and noise, which can lead to frequent stop-outs. Consistent profitability comes from backtesting these formations on your chosen assets to understand their specific success rates.
Frequently Asked Questions
How to Mitigate Risks When Trading Wedge Patterns?
Mitigating risks requires a combination of strict stop-loss placement and volume confirmation. You should never risk more than 1-2% of your total account balance on a single trade. Additionally, waiting for a retest of the broken trendline can filter out many false breakouts, ensuring you only enter when the new direction is confirmed by the market’s behavior.
Is Falling Wedge Pattern Always Bullish?
A falling formation is generally considered bullish because the converging trendlines show that sellers are losing momentum faster than buyers. However, it is not a guarantee. While the falling setup is typically bullish, a break below the lower support line can occur, especially in extremely bearish market conditions, which would invalidate the original bias and lead to further downside.
What Is Optimal Time to Trade Falling Wedge?
The optimal time to trade a falling setup is when the price is near the apex (the point of convergence) and shows a bullish divergence on a momentum oscillator like the RSI. Furthermore, trading this pattern during high-liquidity sessions, such as the London or New York open, increases the chance of a clean breakout with sufficient volume to reach your target.
How Do You Determine Price Target for Wedge Breakout?
To determine the price target, you first calculate the height of the setup at its widest point. This is the vertical distance between the upper and lower trendlines at the start of the formation. You then add this distance to the breakout point for a falling structure or subtract it for a rising version. This technical target represents the minimum expected move following a valid breakout.


