


When you tune into the financial news or check an investing app, you are often greeted by updates on the Dow Jones, the Nasdaq, and the S&P 500. These three names are the undisputed champions of the US stock market, acting as essential barometers for the overall health and direction of the American economy and global investor sentiment. For anyone looking to invest or simply understand market movements, differentiating between these indices is crucial. While all three track baskets of stocks, they differ significantly in their composition, weighting methods, and what segments of the economy they truly reflect. Knowing the difference is the first step toward becoming a more informed trader or investor.
Dow Jones Industrial Average (DJIA)
The Dow Jones Industrial Average is arguably the most famous and historical US stock market index. Established in 1896 by Charles Dow, it has a rich history that mirrors the evolution of American industry. Today, it remains a heavily cited measure, often used as a shorthand to describe the market’s daily mood.
Overview DJIA
The Dow is an index composed of 30 large, publicly-owned companies based in the United States. Despite its name, “Industrial Average,” the index is no longer strictly limited to industrial companies. Its components span diverse sectors including finance, technology, consumer goods, and healthcare. Its small, concentrated list of elite companies means the Dow often represents the performance of established, blue-chip giants, rather than the broader market. When market commentators discuss the performance of “the 30,” they are referring to the Dow.
Composition Selection Criteria
The selection of the 30 companies in the DJIA is not based on rigid, quantitative rules but rather on the judgment of the index committee at S&P Dow Jones Indices. The primary criterion is that the company must have an excellent reputation, demonstrate sustained growth, and be of interest to a large number of investors. The committee aims to maintain adequate representation of the broader US market while keeping the number of components small. Companies are added or removed only when a component company undergoes a major structural change or when index representation needs to be modernized, meaning its composition is far less dynamic than other indices. For example, a significant event like a merger or bankruptcy may necessitate a change.
Weighting Methodology
The Dow Jones Industrial Average is a price-weighted index. This is perhaps its most distinguishing feature and a point of frequent discussion among financial experts. In a price-weighted system, stocks with higher share prices have a greater influence on the index’s value than stocks with lower share prices, regardless of the company’s actual market capitalization.
Illustrative Calculation (Simplified):
Imagine a three-stock index:
- Stock A (Share Price $200)
- Stock B (Share Price $100)
- Stock C (Share Price $50)
Total Share Prices = $350
The index is calculated by dividing the sum of the prices by a divisor. The divisor is continuously adjusted to account for stock splits, dividends, and other structural changes so that these events do not artificially affect the index value.
Expert Observation:
Because of this price-weighting method, a one-dollar change in a high-priced stock will move the Dow’s value more than a one-dollar change in a low-priced stock, even if the low-priced stock is a much larger company by market value. This weighting method is often cited as a limitation because it does not accurately reflect the economic size of the constituent companies.
Dow Jones Performance Comparison
Historically, the Dow’s performance tends to be less volatile than indices dominated by growth stocks, such as the Nasdaq. This stability stems from its focus on mature, large-cap companies that are often past their rapid growth phase and typically pay consistent dividends. Its movements may indicate the health of traditional American industry and the consumer staples sector, but it provides a less detailed picture of the overall US economy compared to the S&P 500.
S&P 500 Index
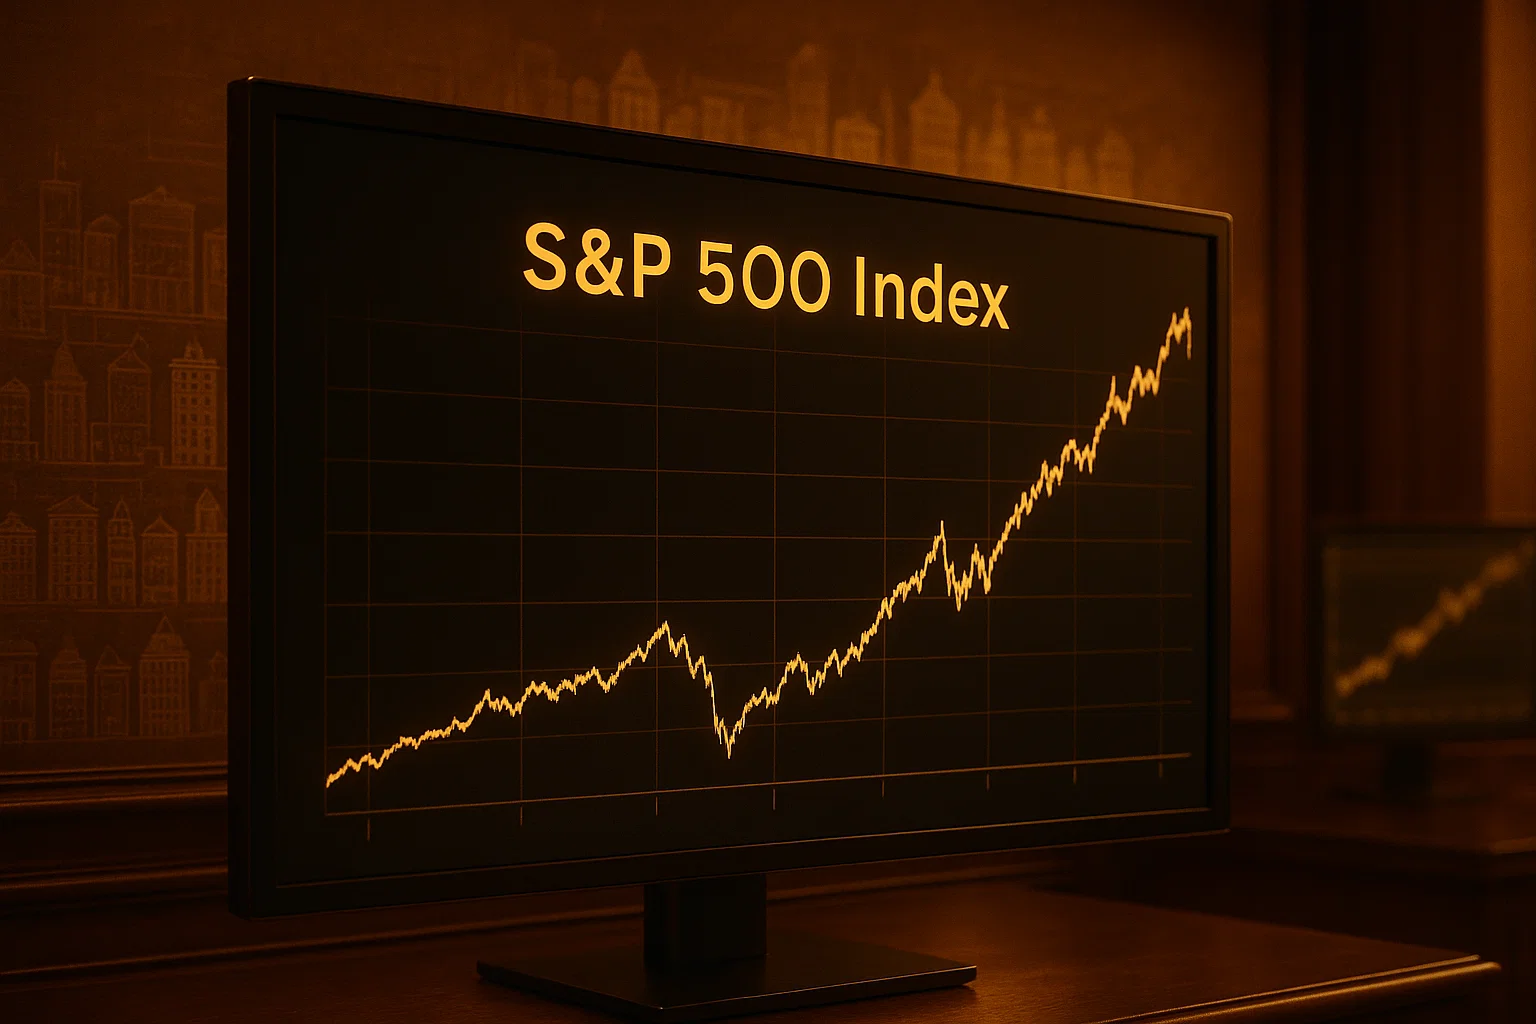
The S&P 500 is the index most widely regarded by professionals as the truest gauge of the US stock market and the broader US economy. Launched by Standard & Poor’s, its composition and methodology provide a deeper, more comprehensive look at market performance.
Overview S&P 500
The S&P 500 tracks 500 of the largest US publicly traded companies. These companies collectively represent about 80% of the total US stock market capitalization. Because of its large scale and diverse composition, the S&P 500 is used as a benchmark for investment performance, an indicator of the large-cap sector’s health, and a foundational element for many mutual funds and exchange-traded funds (ETFs). Its widespread use as a standard makes it essential for comparisons across various investment strategies.
Composition Selection Criteria
In stark contrast to the DJIA’s subjective selection, the S&P 500 uses strict, objective criteria. To be included, a company must:
- Be based in the US.
- Have a market capitalization of at least $15 billion (this figure is reviewed and adjusted periodically).
- Have a history of four consecutive quarters of positive earnings.
- Be highly liquid, with at least 50% of its outstanding shares available to the public (public float).
This rigorous process ensures that the index represents large, stable, and financially healthy companies. The committee overseeing the S&P 500 focuses on sector balance, ensuring that the index is a genuine reflection of the sector weightings within the entire US economy.
Weighting Methodology
The S&P 500 is a market-capitalization-weighted index, often simply called cap-weighted. This means that companies with a larger total market value (share price multiplied by the number of shares outstanding) have a proportionally larger influence on the index’s performance.
Illustrative Calculation (Simplified):
Imagine a three-stock index:
- Stock A: Market Cap $1,000 billion
- Stock B: Market Cap $100 billion
- Stock C: Market Cap $50 billion
Total Market Cap = $1,150 billion
Stock A, with a market cap 10 times larger than Stock B, will move the index 10 times more for an equivalent percentage change in price. This weighting system is favored by most financial professionals because it provides a more accurate representation of how an equivalent dollar investment across all index stocks would perform. However, a drawback is that the index can become highly concentrated in a few mega-cap stocks, which may create risk exposure during periods of high concentration, as seen with the large weighting of technology stocks in recent years.
S&P 500 Performance Comparison
The S&P 500 generally offers a more balanced perspective on market volatility than the Dow or the Nasdaq. Because it covers 500 companies and utilizes market-cap weighting, it is less susceptible to erratic moves from a single stock, as sometimes happens in the price-weighted Dow. Its performance is often viewed as the benchmark for active money managers; if an investment portfolio fails to outperform the S&P 500, many investors suggest that the manager is not generating sufficient value.
Nasdaq Composite Index
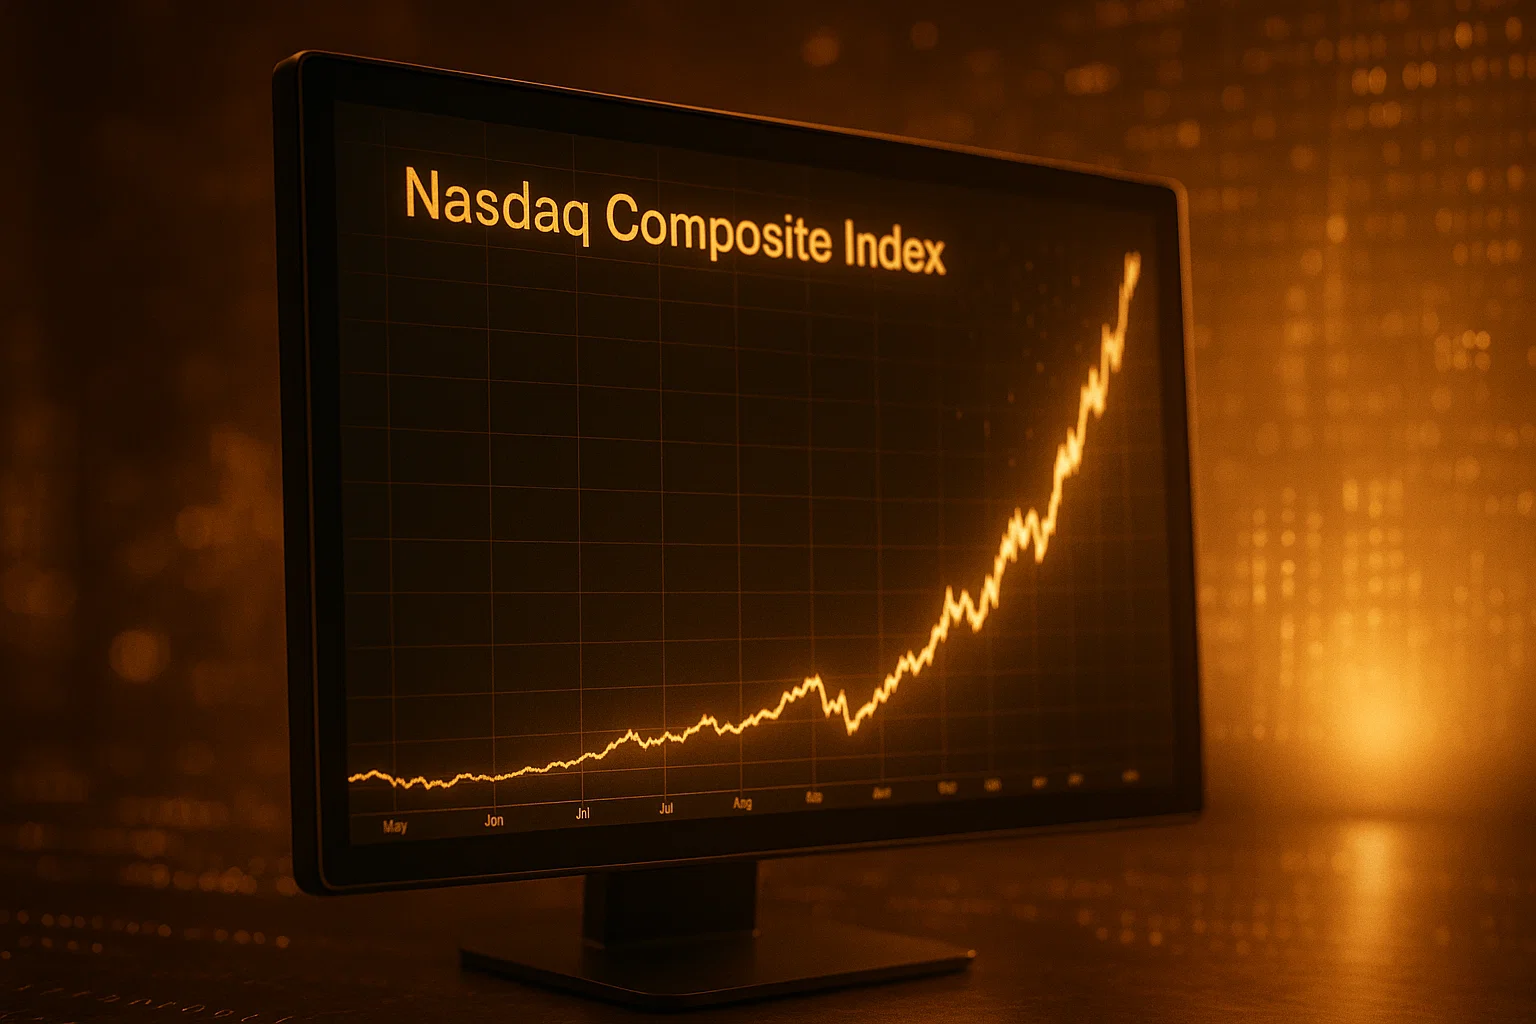
The Nasdaq Composite Index is synonymous with technology, innovation, and growth. It is fundamentally different from the Dow and the S&P 500 in that it is not solely a financial index but rather a catalog of nearly all stocks listed on the Nasdaq Stock Market.
Overview Nasdaq Composite
The Nasdaq Composite includes nearly 3,000 stocks, covering all companies listed on the Nasdaq exchange. This massive pool of stocks includes small-cap, mid-cap, and large-cap companies, but it is heavily weighted toward the technology and biotech sectors. Because of this sectoral concentration, the Nasdaq is considered the best indicator of the health of the technology sector and is the index most sensitive to investor sentiment toward high-growth companies. It captures the performance of both established tech giants and smaller, emerging growth-oriented companies.
Composition Selection Criteria
The criteria for inclusion in the Nasdaq Composite is simply that the stock must be listed on the Nasdaq stock exchange. The exchange has its own listing requirements, which include minimum share prices and market capitalization, but the index itself automatically includes virtually every equity security (excluding things like ETFs and preferred shares) listed on that specific trading venue. This simple inclusion rule results in a much larger and more diverse index in terms of company size, though not necessarily sector.
Weighting Methodology
Similar to the S&P 500, the Nasdaq Composite is a market-capitalization-weighted index. This ensures that the performance of the index is driven by the largest companies, which are overwhelmingly the big tech firms. This weighting methodology means that a rise in the stock price of a company like Apple or Microsoft has a far greater impact on the Nasdaq’s daily movement than a smaller, newly listed biotech firm.
Case Study Observation:
During the dot-com boom of the late 1990s and subsequent collapse, the Nasdaq Composite experienced the most extreme volatility compared to the Dow and the S&P 500. This is a clear real-world demonstration of how the index’s high concentration in growth and technology stocks amplifies both gains and losses. This volatility may indicate higher risk but also potential for higher returns.
Nasdaq Performance Comparison
The Nasdaq Composite is generally the most volatile of the three indices. Its composition of high-growth technology and often younger companies means it can experience rapid price swings based on interest rates, investor appetite for risk, and specific technological trends. When comparing it to the Dow, the Nasdaq tends to outperform during bull markets characterized by rapid innovation and underperform, sometimes sharply, during bear markets or recessions.
Comparing S&P 500, Dow Jones, Nasdaq
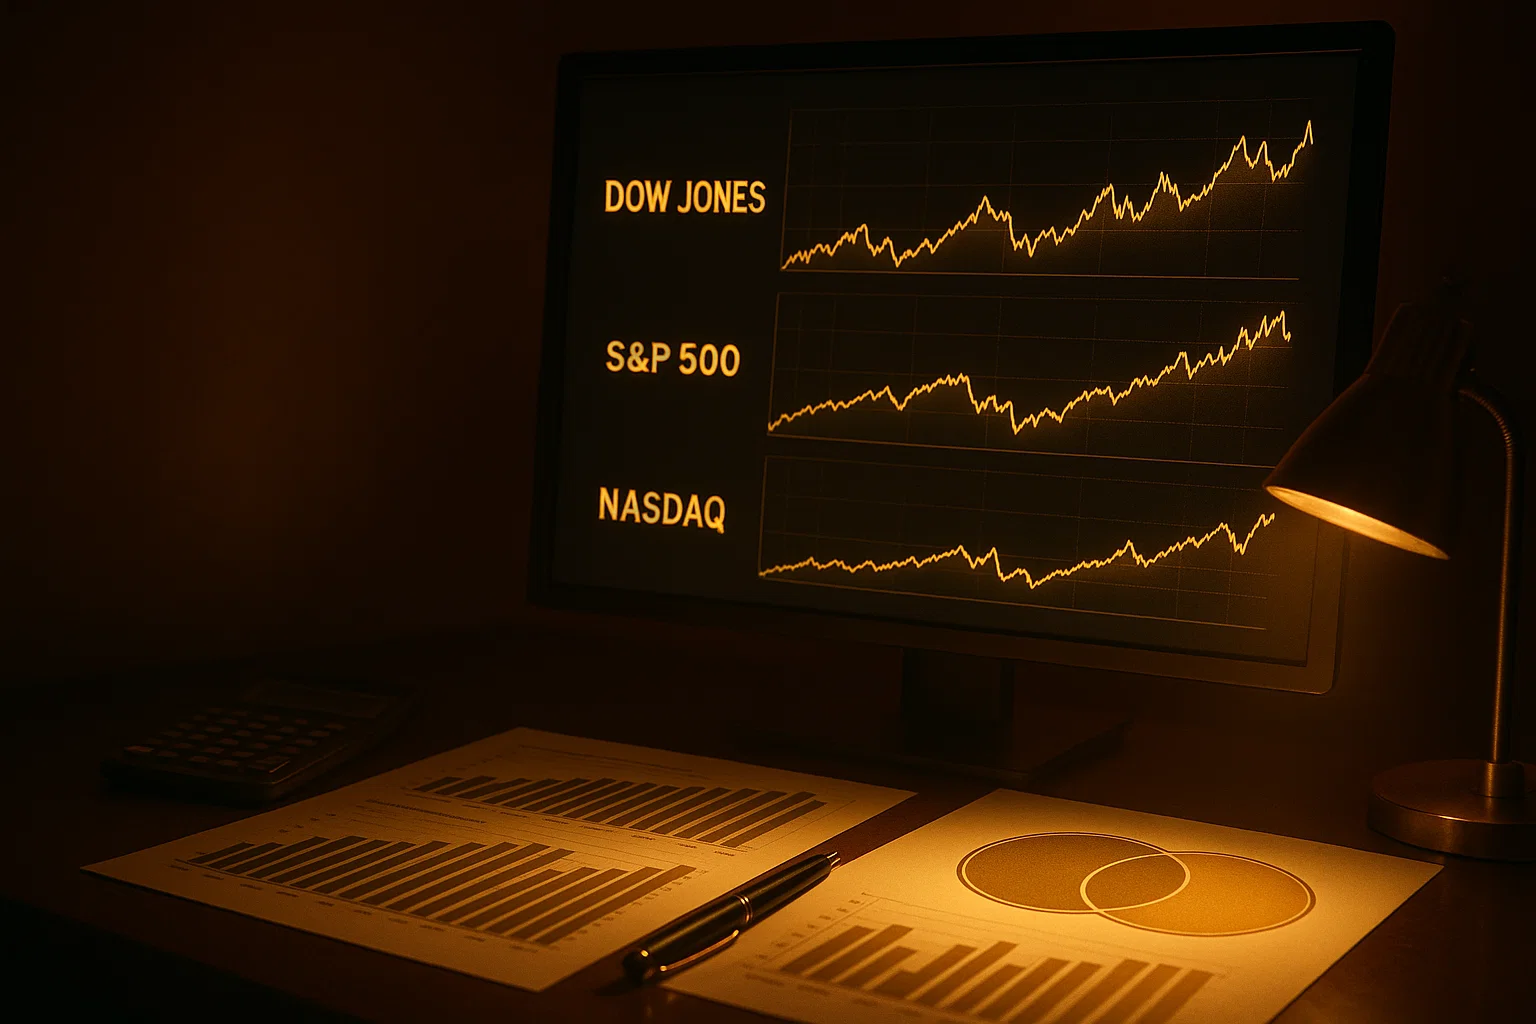
Understanding the fundamental differences between these indices is key to correctly interpreting market data and developing an informed investment thesis. While they may often move in the same direction, the degree of movement and what that movement signifies for the economy can be very different.
Differences Composition
The most significant difference lies in the number and type of companies they track:
- DJIA: A highly selective basket of 30 blue-chip stocks, emphasizing stability and established industry leaders.
- S&P 500: A broad measure of 500 of the largest, most liquid US companies, representing the vast majority of the US market cap.
- Nasdaq Composite: An encompassing index of nearly 3,000 stocks listed on one specific exchange, heavily skewed toward technology and growth sectors.
Weighting Methods
The weighting methodology dictates which stock movements impact the index value the most:
| Index | Weighting Method | Primary Driver of Index Value | Limitation |
|---|---|---|---|
| DJIA | Price-Weighted | Absolute Share Price | Does not reflect company size (market cap) |
| S&P 500 | Market-Cap Weighted | Total Market Capitalization | Highly concentrated in largest few stocks |
| Nasdaq Composite | Market-Cap Weighted | Total Market Capitalization | Highly concentrated in one sector (Tech) |
Market Coverage
Each index provides a different lens on the market:
- DJIA: Best for gauging the performance of established industrial and consumer giants.
- S&P 500: The standard for measuring large-cap US market health and a proxy for the overall US economy.
- Nasdaq Composite: Best for assessing the performance of the US technology and growth sectors.
Performance Comparison: Dow vs S&P vs Nasdaq
In the short term, their performance can diverge dramatically. When there is a flight to quality and investors prefer stability, the DJIA and S&P 500 may hold up better. Conversely, during periods of high-risk appetite, the Nasdaq often registers the largest gains.
Direct Quote:
According to Nobel Laureate Robert Shiller, “The S&P 500 is the best available proxy for the US stock market as a whole, because of its broad coverage and use of market capitalization weighting.” This reinforces the professional consensus regarding the S&P 500’s status as a benchmark.
Which Index Is Best Investing?
There is no single “best” index for investing; rather, the best index depends on your investment objective and risk tolerance.
- If you seek a broad, low-volatility reflection of the overall American large-cap economy, investing tied to the S&P 500 is often the recommended core strategy for its diversification.
- If you want exposure to established, blue-chip dividend-payers, the DJIA might be suitable, although dedicated dividend ETFs may offer better targeted exposure.
- If you have a higher risk tolerance and believe strongly in the sustained growth of the technology sector, the Nasdaq Composite offers the greatest exposure.
Investing Stock Market Indices
You do not invest directly in an index; instead, you invest in financial products designed to mimic the index’s performance. These products offer a simple, cost-effective way to gain broad market exposure.
Index Funds ETFs
The most common ways to invest in indices are through Index Funds (often mutual funds) and Exchange-Traded Funds (ETFs). Both track an underlying index like the S&P 500 or the Nasdaq 100 (a subset of the Composite).
- Index Funds are purchased at the end of the trading day based on their Net Asset Value (NAV). They are typically used for long-term, passive investing.
- ETFs trade on an exchange like a stock, allowing you to buy and sell them throughout the day. They are popular for both long-term holding and tactical trading.
Benefits Index Investing
Investing in indices offers several compelling benefits that appeal to both new and experienced investors:
- Diversification: By purchasing a single fund, you gain exposure to the performance of 30, 500, or thousands of companies, significantly reducing the impact of any single company’s poor performance.
- Lower Costs: Index funds and ETFs typically have very low expense ratios compared to actively managed mutual funds because they do not require expensive research or fund manager teams; they simply replicate the index.
- Simplicity: Index investing is straightforward and requires minimal time for research and management. It allows you to participate in market growth without trying to “beat the market,” a feat that academic studies suggests that most professional investors fail to achieve over the long term.
Popular Index Funds ETFs
There are numerous popular funds tracking these major indices, often managed by large financial institutions. For example, the S&P 500 is tracked by widely known ETFs with low expense ratios, making them staples in many retirement portfolios. These products provide the liquidity and transparency required for compliance with modern financial regulations.
Frequently Asked Questions
What Index Stock Market?
A stock market index is a statistical measure that tracks the performance of a group of stocks, representing a specific segment of the financial market, like large US companies or technology firms, and is used as a benchmark to gauge the performance of the overall market or a particular sector.
How Do You Read Stock Market Index?
You read a stock market index by looking at its current value and its change (in points and percentage) from the previous trading day’s close; a positive change indicates that the aggregate value of the stocks in the index has risen, suggesting generally favorable market sentiment for that segment, while a negative change suggests the opposite.
What Do Stock Market Indexes Indicate?
Stock market indexes indicate the overall health and direction of the economy or a specific market sector; for instance, the S&P 500’s movement is widely seen as an indicator of the general financial health of corporate America, while the Nasdaq’s movement is indicative of the health of the technology and growth industries.
Dow Jones vs S&P 500 vs Nasdaq Performance?
The Dow Jones is generally the least volatile, reflecting established blue-chip companies; the S&P 500 is the best-diversified benchmark for the large-cap US economy, offering balanced returns; and the Nasdaq is the most volatile, offering the highest potential growth during bull markets due to its heavy technology concentration, but also incurring the sharpest declines during downturns.
How Analyze Stock Market Indices?
To analyze stock market indices, you should examine their historical performance, current valuation multiples (like the price-to-earnings ratio of the constituent companies), economic factors (such as interest rates and inflation that affect the sectors they represent), and technical analysis patterns to forecast short-term movements.


