

Navigating the financial markets requires more than just a passing interest in price movement; it demands a deep understanding of market geometry and the psychological shifts that drive participants. For any serious trader, the ability to distinguish between a continuation pattern and a reversal pattern is a foundational skill. These visual representations of market sentiment allow you to anticipate whether an existing trend will persist or if a trend reversal is imminent.
In the fast-paced world of forex and stock trading, price does not move in a straight line. Instead, it ebbs and flows, creating recognizable formations. Approximately 70-89 percent of retail investor accounts lose money when trading CFDs, often due to a failure to recognize these critical transition phases. By mastering technical analysis, you can develop a trading strategy that relies on probability rather than guesswork.
Core Classification of Chart Patterns in Technical Analysis

The classification of formations is the first step toward organized market observation. While the market may appear chaotic, patterns form when the price of an asset consolidates into specific zones, allowing a trader to map out future price expectations.
Theoretical Basis of Trend Patterns and Price Formations
Price patterns are essentially footprints of supply and demand. The theory suggests that after a strong trend, the market requires a period of consolidation. During this time, the price movement is contained within specific trendlines. Patterns indicate the balance of power between buyers and sellers. When the previous trend is strong, the market often forms a chart pattern that acts as a temporary resting spot before the original trend resumes.
Psychology of Market Participants during Trend Continuation
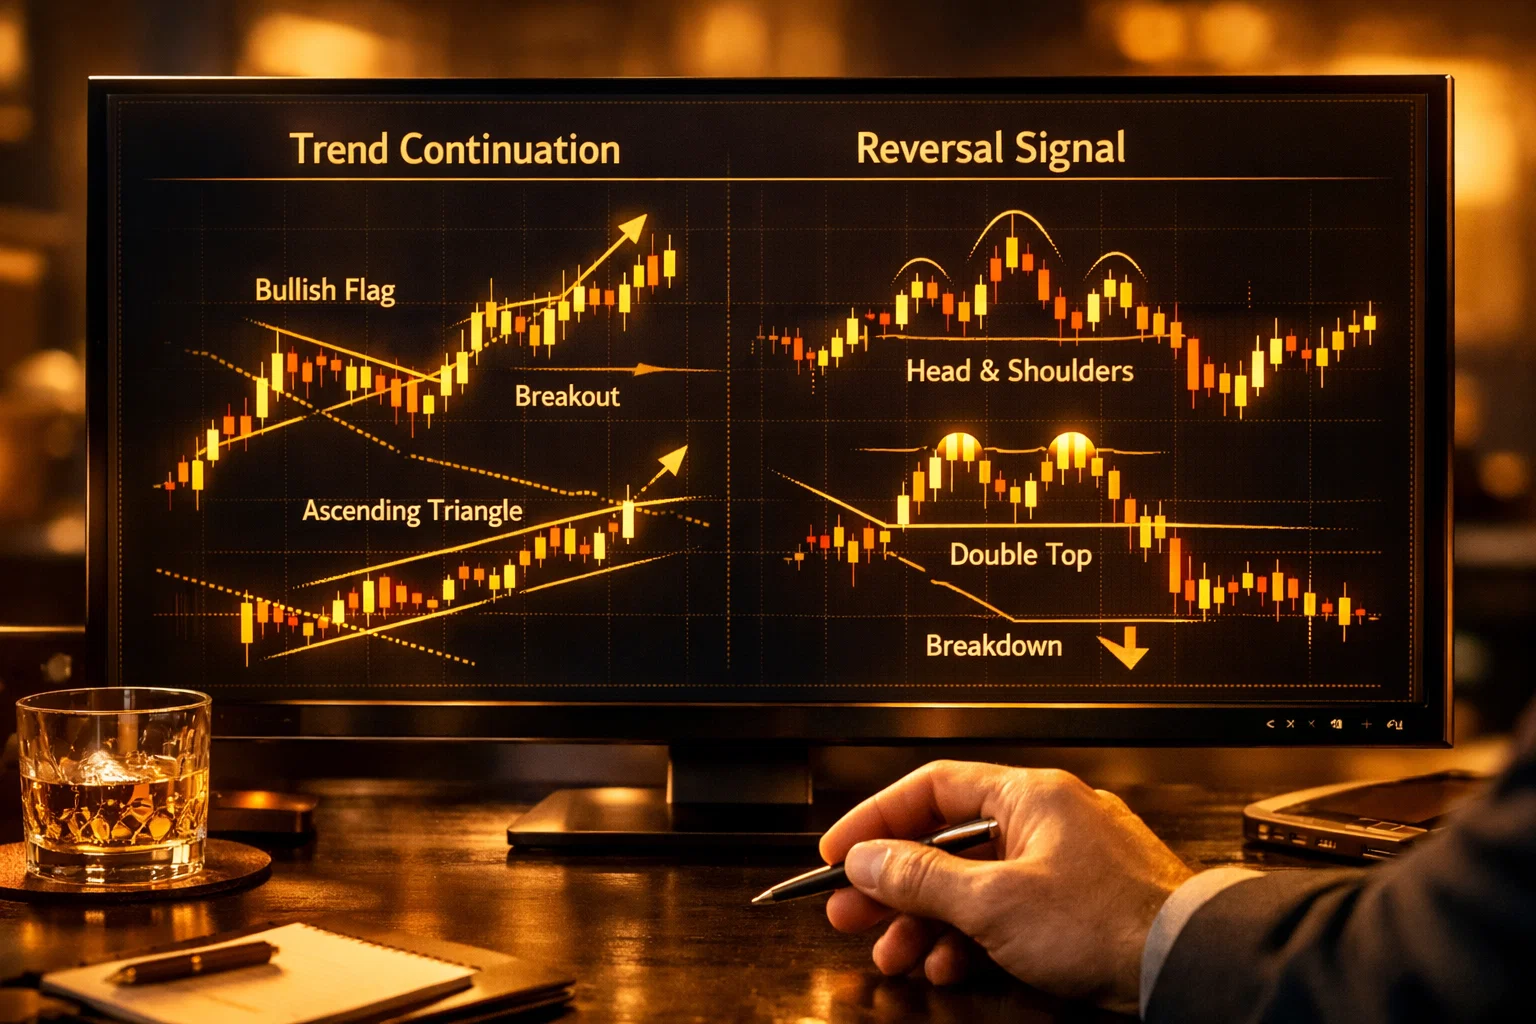
The psychology behind trend continuation is rooted in conviction. When an uptrend hits a resistance level, some traders take profits, causing a minor dip or sideways movement. However, if the bullish sentiment remains high, new buyers enter at these lower prices. This battle creates a continuation pattern, signaling that the current trend is likely to continue once the period of consolidation ends. The completion of the pattern occurs when price breaks out in the direction of the prevailing trend.
Role of Timeframes in Spotting Every Chart Pattern
Patterns can be applied to any timeframe, from one-minute charts to monthly views. However, a pattern looks different depending on the perspective. A head and shoulders pattern on a lower time frame might be a simple blip on a daily chart. Identifying patterns requires consistency; most experts suggest that the higher the timeframe, the more reliable the potential reversal or continuation signal becomes.
Identifying Reversal Chart Signals vs. Momentum Pause
It is vital to distinguish between a momentum pause and a genuine reversal. A reversal pattern suggests that the trend is likely to reverse, meaning the bulls have lost control to the bears, or vice versa. A reversal chart often shows higher volatility and longer formation times compared to a simple continuation or reversal setup. Traders may use technical indicators to confirm if the price trend is truly losing steam or just catching its breath.
| Feature | Continuation Pattern | Reversal Pattern |
|---|---|---|
| Primary Goal | Signal a continuation of trend | Signal that the current trend is ending |
| Typical Duration | Short to medium term | Medium to long term |
| Volume Profile | Decreases during formation | Increases on the breakout |
| Risk Level | Often considered lower risk | Higher risk due to potential false signals |
Common Continuation Patterns: Formations for Trend Persistence
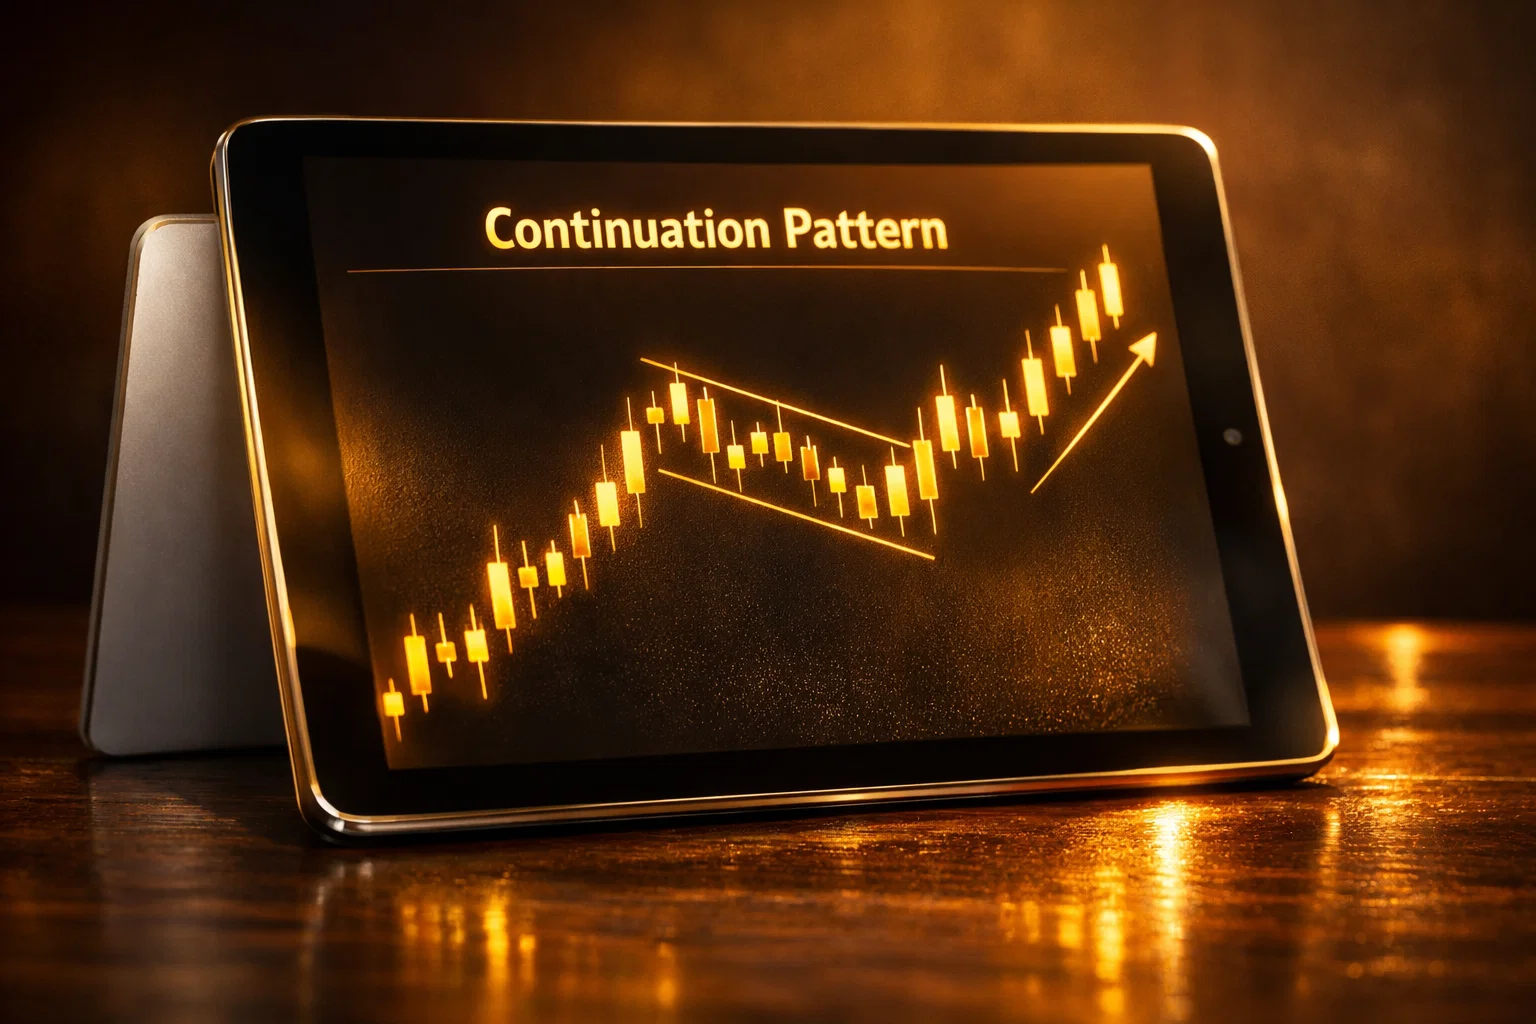
Continuation patterns are formations that signal a temporary pause in an ongoing trend. These patterns indicate that the market is preparing for the next leg of the move.
Classic Rectangle and Consolidation Candlestick Formations
The rectangle is one of the most important continuation and reversal patterns, though it primarily signals trend continuation. It is formed when the price is bounded by parallel horizontal levels of support and resistance. It represents a period where neither bulls nor bears have the upper hand. In a strong trend, a price pattern similar to a rectangle suggests that once price breaks the resistance, the upward trend will resume.
Symmetrical Triangle and Flag Pattern Dynamics
The triangle is a versatile formation. Symmetrical triangle patterns are formed by two converging trendlines of similar slope. While they can signal a reversal and continuation patterns, in an uptrend, they usually lead to a bullish breakout. Conversely, a flag pattern resembles a flag on a pole. It is a sharp, brief consolidation that occurs after a rapid price movement. The flag pattern is highly reliable because it shows that the previous trend was so strong that the pause is minimal.
Pennant Pattern Characteristics and Breakout Targets
A pennant pattern is similar to a small symmetrical triangle but follows a flagpole. It consists of converging trendlines that form after a large move. In your trading, a pennant pattern suggests a brief consolidation before a volatile breakout. Traders often calculate the target by measuring the height of the initial flagpole and adding it to the breakout point.
Cup and Handle Structures as Bullish Continuation and Reversal Indicators
The cup and handle is a classic bullish formation. The “cup” resembles a rounding bottom, while the “handle” is a short period of consolidation. This pattern shows that after a period of selling, buyers have regained control. While typically a continuation pattern, it can also appear at the end of a downward trend, acting as a bullish reversal signal.
Bilateral Formations and Volatility Breaks in Your Trading
Bilateral patterns are unique because they do not have a strong directional bias until the breakout occurs. These patterns signal that the market is at a crossroads. As a trader, you must wait for the price to break through the established trendlines before committing to a trade. This approach helps avoid entering during a failed pattern where the trend direction remains uncertain.
Major Reversal Patterns: Signals of Trend Change
When the market has reached a point of exhaustion, reversal formations appear. These common reversal signals suggest that the original trend has run its course and a new trend is forming.
Classic Head and Shoulders Pattern and Inverse Variations
The head and shoulders is perhaps the most famous reversal pattern in technical analysis. It consists of three peaks: a higher peak (the head) between two lower peaks (the shoulders). The neckline is drawn by connecting the lows of the two troughs. A break below the neckline is a bearish reversal signal. The inverse head and shoulders is the bullish version, appearing after a downtrend and signaling a potential reversal to the upside.
Double and Triple Top/Bottom Reversal Chart Formations
Double tops and double bottoms are frequent in all markets. A double top forms when price hits a resistance level twice and fails to break through, signaling a bearish reversal. Similarly, a triple top consists of three peaks at the same level. On the other side, a triple bottom or double bottom occurs during a downward trend, signaling that the price is likely to reverse upward as sellers lose their grip.
Rising and Falling Wedges as Exhaustion Signals
Wedges can be tricky because their classification depends on where they appear. A rising wedge in an uptrend is a bearish reversal signal, as it shows that buyers are struggling to push prices higher. A falling wedge in a downward trend is a bullish reversal signal. These patterns signal that the momentum is fading, and a trend reversal is imminent.
Quasimodo and Sushi Roll Advanced Reversal Trend Patterns
For experienced traders, the Quasimodo pattern is a powerful reversal formation. It is a variation of the head and shoulders where the second shoulder is higher or lower than expected, “tricking” traders before the real move occurs. The Sushi Roll, popularized by Mark Fisher, is a candlestick pattern involving ten bars where the last five bars engulf the first five, indicating a sudden shift in trend direction.
Rounding Bottoms and Accumulation Phases in Technical Analysis
Rounding bottoms, also known as “saucers,” represent a long-term shift in sentiment. These patterns form over months or even years in stock trading. They show a gradual transition from a downtrend to an upward trend. The pattern shows a slow accumulation of the asset by institutional investors, signaling that the previous trend is finally dead.
Continuation vs. Reversal: Key Differences and Comparison Logic

Understanding continuation vs reversal requires looking at the context of the price trend. The direction of the prevailing trend determines how we interpret any chart pattern we see.
Duration and Volume Characteristics of a Reversal Pattern
A reversal pattern usually takes much longer to form than a continuation pattern. Market participants need more time to change their long-term bias. Furthermore, volume often increases significantly during the completion of the pattern. If a head and shoulders pattern forms with low volume on the head and high volume on the break of the neckline, it is considered more reliable.
Reliability Metrics for a Continuation Pattern Across Asset Classes
In forex, continuation patterns are formations that tend to be very reliable during high-liquidity sessions. In stock trading, a flag pattern or pennant often occurs after positive earnings reports. The reliability of these trend patterns depends on the strength of the original trend. A strong trend is more likely to resume after a brief period of consolidation.
Momentum at Rest vs. Potential Reversal Exhaustion
You can think of a continuation pattern as momentum at rest. The market is taking a breath. A reversal, however, is exhaustion. The price trend has reached a valuation where the opposing force (supply or demand) becomes overwhelming. Technical indicators like the RSI or MACD often show “divergence” during a potential reversal, whereas they stay neutral during a continuation.
Signal Confirmation Requirements for Continuation and Reversal Chart Patterns
Never trade a pattern before it is finished. Confirmation is the most important part of any trading strategy. For a reversal, this might be a candle closing beyond the neckline. For a continuation, it is the price breaks above the resistance of a triangle or flag. Without confirmation, you are susceptible to a false breakout.
Practical Applications of Patterns in Your Trading Strategy
Integrating these patterns into your daily routine requires discipline and a clear set of entry and exit points.
Steps to Successfully Identify and Trade Market Structures
To trade effectively, you should follow a structured process:
- Identify the current trend (uptrend or downtrend).
- Look for a period of consolidation.
- Determine if the pattern looks like a common continuation or reversal formation.
- Draw trendlines to define the support and resistance.
- Wait for the completion of the pattern via a breakout.
Entry Execution: Breakouts vs. Retest of a Reversal
Traders have two main ways to enter. You can enter immediately when the price breaks the pattern boundary. This ensures you don’t miss the move but increases the risk of a false breakout. Alternatively, you can wait for a retest, where the price returns to the broken trendline before continuing. This provides a better reward-to-risk ratio but might result in missing fast-moving trades.
Volume Analysis for Validating a Flag Pattern or Pennant
Volume is the ultimate validator. During the formation of a flag pattern or pennant pattern, volume should ideally decrease. This shows that the consolidation is not a result of heavy selling, but rather a lack of interest. When the breakout occurs, a surge in volume confirms that the ongoing trend is ready to resume with force.
Setting Measured Move Profit Targets for Trend Patterns
Most chart patterns have a built-in “measured move” target. For a triangle, you measure the widest part of the triangle and project that distance from the breakout point. For a head and shoulders, the distance from the head to the neckline is projected downward. This provides a logical exit point for your trade.
Stop-Loss Placement and Risk Management for Every Chart Pattern
Risk management is the difference between a professional trader and a gambler. When trading a reversal pattern, the stop-loss is usually placed just above the most recent peak (for shorts) or below the most recent trough (for longs). For continuation patterns, the stop-loss goes behind the consolidation zone. This ensures that if the pattern fails, your losses are minimized.
Advanced Tools for Continuation and Reversal Patterns
Modern technology has changed how we identify and trade these formations. Using trading tools can increase your efficiency and accuracy.
Pattern Recognition Software and Automated Technical Analysis
Many platforms now offer automated pattern recognition. These tools scan thousands of assets to find an inverse head and shoulders or a triple bottom in seconds. While helpful, you should never rely solely on software. Use these tools to find potential setups, then manually verify them based on your expertise and the current market context.
Backtesting Success Rates for a Specific Head and Shoulders
Not all patterns are created equal. In some markets, a head and shoulders pattern might have a 60 percent success rate, while in others, it might be lower. Backtesting involves looking at historical data to see how often a specific pattern resulted in a successful trade. This data gives you the confidence to execute when the pattern appears in real-time.
Integrating Candlestick Indicators with Continuation and Reversal Formations
Combining candlestick analysis with chart patterns creates a “confluence” of signals. For example, if a bearish reversal pattern forms and the breakout candle is a “shooting star” or an “engulfing” bar, the signal is much stronger. Candlestick patterns provide a micro-view of what is happening at the critical breakout point of the larger chart pattern.
Managing False Breakouts in Trend Continuation Phases
A false breakout occurs when the price moves outside the pattern but quickly reverses back inside. This often happens because large institutional players are “hunting” the stop-losses of retail traders. To manage this, some traders wait for a candle to close outside the pattern on a higher time frame, or they use technical indicators like the ATR (Average True Range) to set a buffer for their entries.
Frequently Asked Questions
How do volume spikes impact breakout reliability for a chart pattern?
Volume acts as the fuel for price movements and serves as a vital confirmation tool in technical analysis. When a price breaks out of a consolidation zone or a neckline with a significant increase in volume, it suggests that there is strong institutional participation behind the move. Conversely, a breakout on low volume is often a warning sign of a false breakout, indicating that the market may not have enough conviction to sustain the new trend direction. Therefore, high volume on the breakout candle typically increases the probability that the continuation or reversal signal is genuine.
Which formations offer highest reward-to-risk ratios in your trading?
Formations that occur after a long, steady trend often provide the most lucrative opportunities because they signal a major shift in market sentiment. The head and shoulders pattern and triple top or triple bottom are well-regarded for their high reward-to-risk potential, as the price targets are often significant relative to the stop-loss distance. Additionally, flags and pennants offer excellent ratios because the consolidation is usually very tight, allowing for a close stop-loss while aiming for a measured move that matches the height of a large preceding flagpole.
Why do failed reversal patterns often become continuation signals?
A failed pattern occurs when the market attempts to reverse but fails to find enough follow-through, leading the price to snap back into the original trend. This often results in an even stronger move in the direction of the prevailing trend because the traders who bet on the reversal are forced to close their positions, adding buy or sell pressure. For instance, if a head and shoulders pattern fails to break the neckline and instead breaks above the right shoulder, it effectively becomes a signal that the bullish trend is likely to continue with renewed momentum.
Does algorithmic trade affect traditional head and shoulders pattern accuracy?
High-frequency trading and algorithms have certainly changed the intraday dynamics of chart patterns, often causing more volatility and “noise” around traditional support and resistance levels. Algorithms are programmed to recognize these patterns, which can lead to rapid price movements at the neckline or breakout points. However, the core psychological principles behind a head and shoulders pattern remain valid over longer timeframes. While algorithms might create more false signals on one-minute charts, the broad human emotions of fear and greed still manifest in recognizable formations on daily and weekly charts.
When should traders ignore a reversal during high-impact news?
Technical patterns should generally be viewed with caution or entirely ignored during major economic announcements, such as interest rate decisions or employment data releases. During these times, fundamental news takes precedence over technical formations, often leading to extreme volatility that can easily trigger stop-losses on both sides of a pattern. A potential reversal that looks perfect on a chart can be instantly invalidated by a surprise news event. In such cases, it is often safer to wait for the market to stabilize and for a new trend to establish itself before relying on chart signals again.


