

The bull flag chart pattern stands as one of the most reliable continuation patterns in technical analysis, offering traders clear entry and exit signals across stocks, forex, and cryptocurrencies. This pattern represents a brief pause in a strong uptrend before the price resumes its upward trajectory, making it an essential tool for both day trading and longer-term position strategies.
What is a Bull Flag Chart Pattern?
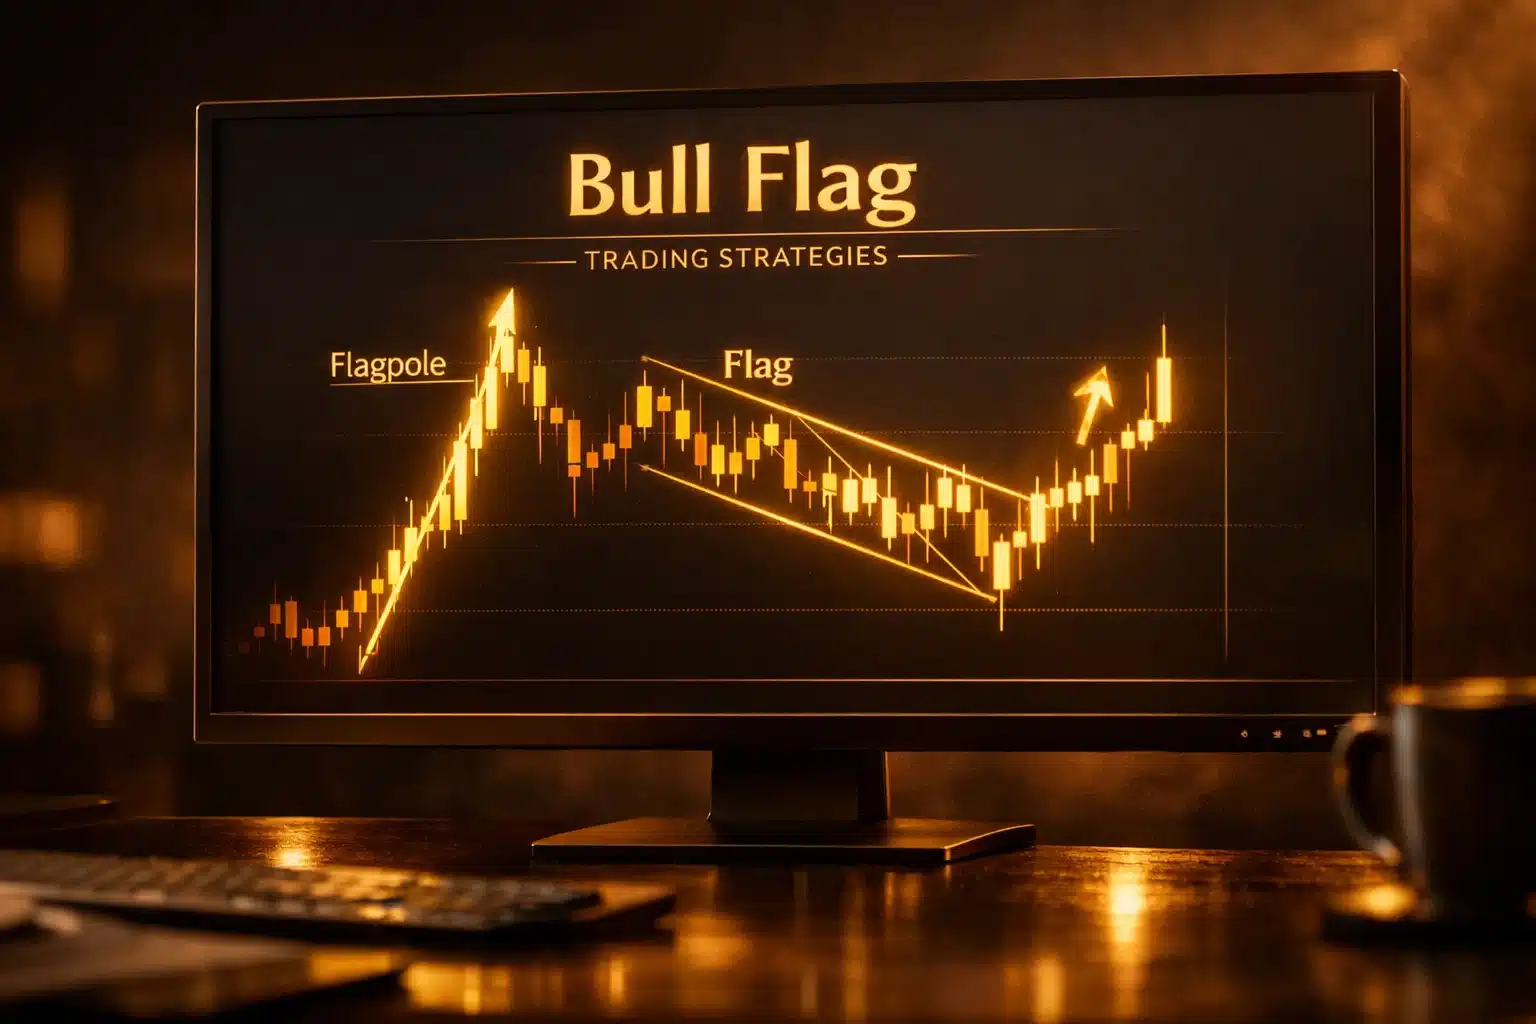
A bull flag pattern occurs when a sharp upward price movement (the flagpole) is followed by a consolidation phase (the flag) that slopes slightly downward or moves sideways within parallel trendlines. The pattern is formed when buyers temporarily pause during a strong rally, creating lower highs and lower lows before ultimately pushing the price to new heights.
According to historical data from technical analysis studies, bull flag patterns demonstrate success rates between 60-70% when properly identified and traded with volume confirmation. This makes the bull flag one of the more dependable chart patterns available to traders.
The Anatomy of a Bull Flag
Understanding the three distinct phases of this continuation pattern is critical for accurate pattern recognition:
Phase 1: The Flagpole
The pattern begins with a sharp, impulsive upward movement characterized by:
- Significant buying pressure and momentum
- Notably increased trading volume
- A clear directional move, typically resulting from positive catalysts or market sentiment
- A vertical distance that establishes the baseline for profit projections
The strength of the flagpole directly correlates with pattern reliability. A weak or gradual ascent reduces the probability of a successful breakout.
Phase 2: The Flag Formation
Following the initial surge, the price enters consolidation where it:
- Forms a downward-sloping channel bounded by parallel trendlines
- Creates a series of lower highs and lower lows
- Exhibits significantly decreased trading volume
- Lasts from several days to multiple weeks, depending on the timeframe
This consolidation reflects profit-taking by early buyers rather than a fundamental shift in market sentiment. The reduced volume during this phase indicates that sellers lack conviction.
Phase 3: The Breakout
The pattern culminates when:
- Price breaks decisively above the upper boundary of the flag
- Volume surges, confirming renewed buying interest
- The breakout point establishes the entry level for trades
- Price acceleration typically follows, validating the continuation pattern
Bull Flag pattern vs. Bear Flag: Understanding the Distinction
While both flag chart patterns follow similar structural principles, their directional bias differs fundamentally:
Bull Flag Characteristics
- Flagpole moves sharply upward
- Flag consolidates downward or sideways
- Breakout occurs to the upside
- Signals continuation of an existing uptrend
- Bullish market psychology dominates
Bear Flag Pattern Characteristics
- Flagpole moves sharply downward
- Flag consolidates upward or sideways
- Breakout occurs to the downside
- Signals continuation of an existing downtrend
- Bearish sentiment prevails
Understanding both bull and bear flag patterns allows traders to identify continuation opportunities in both rising and falling markets. However, traders should avoid attempting to trade bull flags in bearish market environments, as these setups frequently fail.
How to Identify a Bullish Flag on Your Charts: Trading Guide

Successful flag trading requires systematic pattern recognition. Follow this step-by-step process:
Step 1: Locate the Flagpole
Begin by scanning your daily chart or preferred timeframe for:
- Strong, impulsive upward movements
- Clear directional momentum lasting several candles
- Volume bars that exceed the recent average
- A vertical rise of at least 10-20% in stocks (percentage varies by asset class)
The flagpole should appear visually distinct—not a gradual climb but a sharp surge that catches your attention immediately.
Step 2: Recognize the Consolidation
After identifying a potential flagpole, wait for the price to:
- Pull back from the highs in a controlled manner
- Form parallel trendlines that slope downward
- Create lower swing highs and lower swing lows
- Display reduced volume compared to the flagpole phase
Draw trendlines connecting the highs and lows during consolidation. If these lines are roughly parallel and slope downward, you’ve identified the flag component of the bull flag pattern.
Step 3: Confirm Critical Validation Criteria
Before considering a trade, verify these essential characteristics:
Volume Dynamics
- High volume during the flagpole confirms strong demand
- Declining volume during the flag shows sellers lack conviction
- Surging volume at the breakout validates buyer commitment
Research by technical analysts suggests that volume confirmation reduces false breakout rates by approximately 40-50%.
Structural Integrity
- The flag must form within clearly defined parallel channels
- The consolidation should retrace 38-50% of the flagpole (deeper retracements may indicate weakness)
- The pattern should complete within a reasonable timeframe (flags that consolidate too long lose predictive power)
Trend Alignment
- The broader market context should support the bullish setup
- Higher timeframes should confirm the uptrend remains intact
- Avoid bull flags forming against major resistance levels
Trading Strategies for Bull Flag Patterns
Successful traders employ multiple approaches to trade the bull flag, each offering distinct advantages depending on market conditions and risk tolerance.
Trader Strategy 1: The Breakout Entry Method
This direct approach captures momentum immediately after pattern confirmation.
Execution Steps:
- Wait for a candle to close decisively above the flag’s upper trendline
- Confirm the breakout occurs on volume exceeding the consolidation average
- Enter the trade on the close of the breakout candle or the open of the next candle
- Place a stop-loss just below the lowest point within the flag formation
Entry Point Considerations
Some traders prefer waiting for a second confirming candle to filter false breakouts. While this reduces the number of whipsaws, it may result in missing rapid momentum moves. The trade-off between confirmation and entry price should align with your risk management style.
Stop-Loss Placement
Position your protective stop below the flag’s lowest point with a 1-2% buffer for volatility. For a stock breaking out at $150 with a flag low at $145, a stop at $144.50 provides protection while allowing normal price fluctuation.
Profit Target Calculation
Measure the vertical distance of the flagpole, then project this same distance upward from the breakout point. If the flagpole moved $30 and the breakout level is $150, your initial target becomes $180. This measured move technique derives from classical technical analysis principles established by pioneers like Thomas Bulkowski, whose research on chart patterns spans decades.
Risk-Reward Assessment
Aim for a minimum 1:2 risk-reward ratio. Using the example above, if your risk is $5.50 (from $150 entry to $144.50 stop), your potential reward of $30 provides a 1:5.45 ratio—well above the minimum threshold.
Trader Strategy 2: The Pullback Entry Method
This conservative approach prioritizes superior risk-reward ratios over immediate entry.
Execution Process:
- Observe the initial breakout above the flag’s resistance
- Wait for the price to pull back and retest the broken resistance as new support
- Enter when the price bounces from this retest level, typically confirmed by a bullish candle close
- Place a tighter stop-loss below the retest point
Advantages and Limitations
The pullback method offers several benefits:
- Improved entry price compared to the initial breakout
- Tighter stop-loss placement, enhancing risk-reward ratios
- Confirmation that the breakout level now acts as support
- Potential for 1:3 or 1:4 risk-reward setups
However, this strategy requires patience. Historical data suggests that only 40-60% of breakouts offer a pullback opportunity. In strongly trending markets, prices may accelerate immediately after breaking out, leaving pullback traders behind.
When to Apply This Strategy
Use the pullback method when:
- The initial breakout occurs on moderate rather than explosive volume
- Multiple bullish patterns are emerging simultaneously
- You’re managing a larger position size requiring optimal entry pricing
- Market conditions suggest consolidation is likely after the breakout
Trader Strategy 3: Multi-Timeframe Confirmation
Advanced traders use multiple chart timeframes to filter low-probability setups and increase pattern reliability.
Implementation Framework:
- Identify the bull flag chart pattern on your primary trading timeframe (e.g., 1-hour chart)
- Examine the same asset on a higher timeframe (e.g., 4-hour or daily chart)
- Confirm the higher timeframe shows an intact uptrend supporting the lower timeframe pattern
- Check that the lower timeframe breakout aligns with higher timeframe support or momentum
- Enter the trade only when both timeframes confirm bullish alignment
Practical Example
Suppose you identify a bull flag on the 1-hour chart with a breakout level at $200. Before entering, check the daily chart:
- Does the daily chart show a clear uptrend?
- Is the $200 level aligned with daily support or a moving average?
- Does the daily timeframe show increasing volume or momentum indicators trending upward?
If all factors align, the probability of a successful continuation increases substantially. Research suggests multi-timeframe confirmation can improve win rates by 15-25% compared to single-timeframe analysis alone.
Psychology Behind the Bull Flag Chart Pattern
Understanding market psychology enhances pattern recognition and trading execution. The bull flag reflects a specific emotional cycle:
During the flagpole phase, early adopters and momentum traders drive prices higher rapidly. This creates FOMO (fear of missing out) among late participants. As the flag forms, early buyers take profits while new participants hesitate, creating the consolidation phase. The reduced volume indicates a balance between profit-taking and cautious buying—not bearish sentiment.
When the price breaks out, the psychological shift is profound. Early buyers who took profits may re-enter, traders who missed the initial move now have a second opportunity, and technical traders specifically hunting for flag patterns trigger buy orders simultaneously. This convergence of buying interest creates the explosive momentum that characterizes successful bull flag breakouts.
Advanced Exit Strategies and Profit Management for Traders
Professional traders employ sophisticated exit techniques that balance profit capture with extended opportunity.
The Scaling Exit Approach
Rather than closing your entire position at a single price level, scale out systematically:
Position Allocation Example:
- Exit 40-50% at the measured move target (the flagpole height projected from the breakout)
- Hold 25-30% with a trailing stop-loss moved to breakeven
- Keep 20-25% as a runner position with wider trailing stops for potential extended gains
This approach ensures you lock in profits while maintaining exposure if the trend continues beyond initial projections. Data from professional trading firms suggests scaled exits outperform all-or-nothing approaches by 15-30% over time.
Dynamic Stop-Loss Management
Once the price advances beyond the initial target:
- Move your stop-loss to the breakout point, ensuring a profitable trade
- As new swing lows form, trail your stop below these levels
- Consider using a percentage trailing stop (e.g., 5-8% below the highest high)
- Tighten stops as the trend matures to protect accumulated profits
Trailing Stop Example
If you enter at $150 with an initial target of $180, and the price reaches $190:
- Move your stop to $150 (breakeven)
- As the price reaches $200, trail your stop to $184 (8% trailing stop)
- Continue trailing as new highs emerge
Extended Target Scenarios
In strongly trending markets, prices may exceed the measured move significantly. Consider these extended targets:
- 1.618 Fibonacci extension: Project 1.618 times the flagpole height for aggressive targets
- Previous resistance levels: Identify major resistance zones on higher timeframes as potential extended targets
- Round number resistance: Stocks often pause at psychologically significant levels ($100, $150, $200)
Avoiding False Breakouts and Bull Traps
False breakouts represent the greatest risk when trading bull flag patterns. A failed bull flag occurs when the price briefly breaks above resistance before reversing sharply downward, trapping traders who entered the breakout.
Critical Filters for False Breakout Prevention
Volume Confirmation: The Non-Negotiable Filter
The most reliable indicator of breakout authenticity is volume. Studies by technical analysts suggest that breakouts on volume at least 50% above the consolidation average have a 65-75% success rate, compared to just 35-45% for low-volume breakouts.
Before entering any trade, verify:
- Breakout volume exceeds the 20-period average volume
- Ideally, breakout volume approaches or exceeds the flagpole volume
- Volume continues to expand as the price moves higher after the breakout
The Consecutive Close Requirement
Wait for at least one full candle to close completely above the flag’s resistance. Even better, wait for two consecutive closes. This simple filter eliminates 40-60% of false breakouts according to backtesting data.
Post-Breakout Price Action Analysis
Examine how the price behaves immediately after breaking out:
- Does it accelerate higher with momentum?
- Do subsequent candles continue to close above the breakout level?
- Is the price forming a base above the resistance, suggesting consolidation before the next leg?
If the price stalls, forms bearish candlestick patterns, or closes back within the flag, exit immediately. These signals indicate the breakout lacks conviction.
Macro Trend Context Verification
Ensure the bull flag pattern aligns with the broader market trend. A bull flag attempting to break out while:
- Major indices are declining
- The daily chart shows a clear downtrend
- The asset is approaching major resistance from previous periods
These scenarios significantly increase false breakout probability. In such cases, it may be wiser to wait for the price to clear these resistance levels before committing capital.
Identifying Bull Traps Before Entry
A bull trap occurs when institutional traders or market makers intentionally push prices above resistance to trigger stop-losses and trap retail buyers before reversing the price downward. While impossible to eliminate entirely, you can spot warning signs:
Warning Sign 1: Breakout on Gap
If the price gaps significantly above the flag’s resistance at the market open, exercise caution. While gaps can signal strong momentum, they also create areas of no price discovery that may fill later. Wait for the price to consolidate above the gap before entering.
Warning Sign 2: Extreme Breakout Candle
A breakout candle with an exceptionally long wick above the body suggests strong rejection at higher levels. If buyers couldn’t maintain those elevated prices, the breakout may fail.
Warning Sign 3: Divergence with Market Internals
If the stock or currency pair breaks out while:
- Market breadth indicators are declining
- Sector peers are weakening
- Volume leaders in the market are rolling over
This divergence suggests the breakout may be isolated rather than part of a broader market move, increasing failure risk.
Risk Management and Position Sizing for Bull Flag Trading
Even the most reliable chart pattern requires disciplined risk management to generate consistent profits. Professional traders distinguish themselves not through pattern recognition alone, but through sophisticated capital preservation techniques.
Fundamental Position Sizing Principles
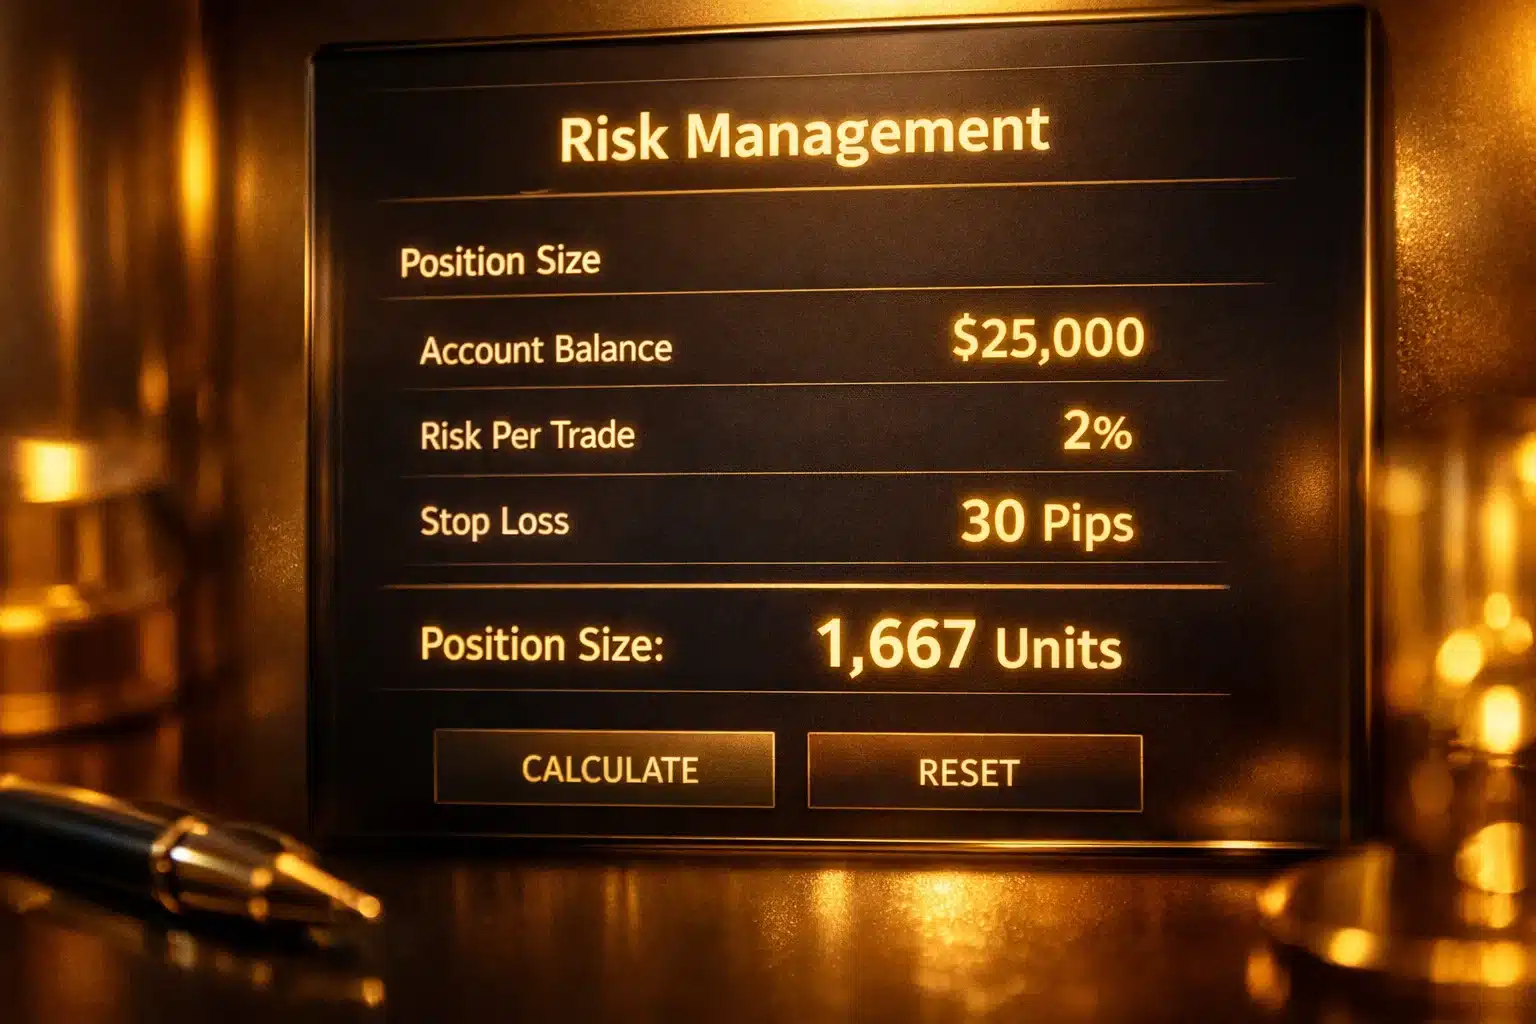
The 1-2% Rule
Never risk more than 1-2% of your total trading capital on any single trade. This principle ensures that even a series of consecutive losses won’t significantly impair your account. For a $50,000 account, a 2% risk allocation equals $1,000 per trade.
Calculating Position Size Based on Stop Distance
Work backward from your acceptable risk to determine position size:
- Calculate the distance from entry to stop-loss in points or pips
- Divide your risk allocation by the stop distance
- The result is your maximum position size
Example Calculation:
- Account size: $50,000
- Risk per trade: 2% ($1,000)
- Entry price: $150
- Stop-loss: $145
- Stop distance: $5
Position size = $1,000 ÷ $5 = 200 shares
This approach ensures your stop-loss distance directly determines position size, preventing oversized positions in volatile conditions.
Portfolio Allocation Strategies
For Cash Accounts:
- Top conviction setups: 15-20% of capital
- Strong probability trades: 10-15% of capital
- Standard setups: 7.5-10% of capital
- Speculative or learning trades: 5-7.5% of capital
For Margin Accounts:
Leverage amplifies both gains and losses. If using margin:
- Increase top conviction trades to 25-30% of capital
- Maintain standard positions at 15-20% of capital
- Never exceed 2:1 effective leverage on overall portfolio
- Reserve margin capacity for drawdown management
Concentration vs Diversification
While traditional investment advice emphasizes diversification, active traders benefit from focused concentration on high-probability setups. Managing 5-10 positions allows for:
- Adequate attention to each trade
- Meaningful position sizes that impact portfolio returns
- Clear risk monitoring across all positions
- Flexibility to add or reduce positions as market conditions change
Over-diversification (20+ positions) dilutes focus and reduces the impact of your best trades while complicating risk management.
Common Mistakes That Undermine Bull Flag Profitability

Even experienced traders fall victim to these pitfalls when trading flag patterns.
Mistake 1: Premature Entry During Flag Formation
The temptation to enter the trade while the flag is still forming proves costly for many traders. The psychology is understandable—you’ve identified the pattern early and want to secure a better entry price. However, historical data shows that prices frequently continue lower during consolidation, testing the flag’s lower boundary before reversing.
The Consequence: You endure drawdown while waiting for the breakout, increasing emotional pressure to exit prematurely. Worse, if the pattern fails and breaks downward, you’re caught on the wrong side of the trade.
The Solution: Exercise patience. Wait for the price to break above the flag’s upper trendline with volume confirmation. The slightly higher entry price is worthwhile for the confirmation it provides.
Mistake 2: Trading Ambiguous or Low-Quality Patterns
Not every consolidation after an upward move qualifies as a tradeable bull flag. Weak patterns lacking clear structure generate inconsistent results:
- Flags without parallel trendlines
- Consolidations that move sideways rather than sloping downward
- Patterns where the flagpole lacks strong momentum
- Flags that consolidate for too long relative to the flagpole duration
The Consequence: Low-quality patterns produce false breakouts at a significantly higher rate, eroding trading capital and confidence.
The Solution: Be selective. Only trade bull flags with clearly defined structure, strong flagpoles, and appropriate duration. If you’re uncertain whether a pattern qualifies, skip it. Numerous high-quality setups emerge regularly across markets.
Mistake 3: Ignoring Volume Confirmation
This mistake ranks among the most detrimental to bull flag trading success. Volume provides the crucial confirmation that distinguishes genuine breakouts from false moves.
The Consequence: Trading breakouts on low volume results in a success rate below 40%, compared to 65-75% for volume-confirmed breakouts. This 25-35% difference in win rate transforms a profitable strategy into a losing one.
The Solution: Make volume confirmation mandatory for every trade. Use volume indicators on your chart and establish minimum thresholds (e.g., breakout volume must exceed the 20-period average by at least 50%).
Mistake 4: Using Inappropriate Timeframes
The bull flag pattern works effectively on hourly, 4-hour, and daily charts but generates excessive false signals on very short timeframes.
The Disadvantages of Bull Flag Trading on 5-15 Minute Charts:
- Market noise creates numerous false patterns
- Spreads and commissions consume a larger percentage of profits
- Emotional pressure increases with rapid price fluctuations
- Lower conviction among market participants reduces pattern reliability
The Solution: Reserve bull flag trading for timeframes of 1 hour and above. If you must trade intraday, use 15-minute or 30-minute charts as the absolute minimum, and increase your confirmation requirements.
Mistake 5: Setting Inadequate Profit Targets
Traders sometimes place profit targets just above the flag’s resistance, hoping to capture quick profits. This approach frequently results in premature exits that prevent capturing the pattern’s full potential.
The Consequence: You achieve a low win rate because minor pullbacks stop you out before the measured move completes, while your winners generate insufficient profit to compensate for losses.
The Solution: Use the full flagpole measurement for your initial target. This gives the trade adequate room to develop. If you prefer to lock in profits earlier, scale out of half your position at intermediate levels while holding the remainder for the full target.
Real-World Application: Trading a Bull Flag in the Forex Market
Understanding theory is essential, but examining a practical example demonstrates how these principles function in live trading conditions.
Market Setup:
EUR/USD rallies from 1.0800 to 1.0950 over three days on the back of dovish Federal Reserve commentary. This 150-pip move represents the flagpole. Subsequently, the pair consolidates between 1.0920 and 1.0930 for four days, forming lower highs and lower lows within parallel downward-sloping trendlines. Volume indicators show declining activity during this consolidation.
Pattern Confirmation:
On day five, a 4-hour candle closes decisively at 1.0935, breaking above the 1.0930 resistance level. Volume surges to 1.8 times the consolidation average, confirming genuine buying interest.
Trade Execution:
- Entry: 1.0936 (just above the confirmed breakout)
- Stop-loss: 1.0918 (two pips below the flag’s lowest point at 1.0920)
- Risk: 18 pips
- Target: 1.1086 (projecting the 150-pip flagpole from the 1.0936 entry)
- Potential reward: 150 pips
- Risk-reward ratio: 1:8.33
Trade Management:
At 1.1000 (64 pips profit), you exit 40% of the position, locking in gains. You move the stop-loss to breakeven at 1.0936. At 1.1050 (114 pips profit), you exit another 30%, moving the stop to 1.1020 to protect profits on the remaining 30%. The final 30% remains active with a trailing stop, ultimately exiting at 1.1095 when the price reverses.
Final Results:
- 40% of position: 64 pips gain
- 30% of position: 114 pips gain
- 30% of position: 159 pips gain
- Weighted average: 108.3 pips profit
- With 18 pips risk and 108.3 pips average profit, actual risk-reward: 1:6.02
This example illustrates how the measured move technique provides a solid foundation for profit targets, while scaling exits allows you to capture extended moves without risking all accumulated profits.
Integrating Bull Flags with Other Technical Analysis Tools
While bull flag patterns provide standalone trading opportunities, combining them with complementary indicators enhances conviction and filtering capability.
Moving Average Confirmation
Bull flags emerging from above key moving averages show higher success rates:
- The 50-period moving average often provides dynamic support during flag formation
- Breakouts that occur while the price remains above the 200-period moving average align with the long-term trend
- Moving average crossovers occurring near the breakout point provide additional confirmation
A study examining 500+ bull flag patterns found that flags forming above the 50-period moving average succeeded 72% of the time, compared to just 51% for patterns below this average.
Relative Strength Index (RSI) Analysis
The RSI provides insight into momentum and potential reversals:
- During flag formation, RSI typically declines from overbought levels (above 70) toward neutral (40-60)
- At the breakout point, RSI should turn upward, confirming renewed momentum
- Avoid trading bull flags where RSI shows bearish divergence (price making higher highs while RSI makes lower highs)
Support and Resistance Level Alignment
The highest-probability bull flag breakouts occur when:
- The breakout point doesn’t face immediate resistance from previous price action
- The measured move target aligns with a previous resistance level that may act as a magnet for price
- The flag’s lower boundary coincides with a significant support level
Chart analysis software like those offered by INFINOX trading platforms allows traders to overlay multiple technical tools simultaneously, facilitating this multi-factor analysis efficiently.
Fibonacci Retracement Integration
Fibonacci levels help assess whether the flag’s retracement depth suggests strength or weakness:
- 38.2% retracement: Indicates strong underlying momentum; bulls remain in control
- 50% retracement: Represents typical consolidation depth; neutral signal
- 61.8% retracement: Suggests weakening momentum; increases failure risk
Flags that retrace more than 61.8% of the flagpole should be approached with caution, as deeper retracements indicate sellers are gaining control.
Day Trading vs Swing Trading Bull Flag Patterns
The timeframe you trade significantly influences execution strategy and profit expectations.
Day Trading Bull Flags
Day traders typically work with 15-minute to 1-hour charts, seeking to capture intraday continuation moves.
Advantages:
- Multiple opportunities daily across various instruments
- Reduced overnight risk exposure
- Ability to realize profits within hours
- Lower capital requirements per trade due to tighter stops
Challenges:
- Higher false breakout rates on shorter timeframes
- Spread and commission costs consume a larger percentage of profits
- Requires constant monitoring and faster decision-making
- Greater emotional pressure from rapid price movements
Optimal Approach for Day Trading:
Focus on liquid instruments (major currency pairs, large-cap stocks) where spreads remain tight and volume is consistent. Require stronger volume confirmation than on longer timeframes—ideally 2x the consolidation average. Consider taking profits at 75-80% of the measured move rather than waiting for the full target, as intraday momentum often fades before reaching theoretical targets.
Swing Trading Bull Flags
Swing traders use 4-hour and daily charts, holding positions from several days to weeks.
Advantages:
- Higher pattern reliability on longer timeframes
- Reduced transaction costs relative to profit potential
- Less time-intensive monitoring requirements
- Ability to capture larger moves that develop over days
Challenges:
- Exposure to overnight gap risk from news events
- Larger stop-losses require more capital per position
- Fewer setup opportunities compared to day trading
- Requires patience to allow patterns to develop fully
Optimal Approach for Swing Trading:
Use daily charts for primary analysis with 4-hour charts for precise entry timing. Place wider stops to accommodate normal volatility, and plan for measured moves that may take 1-3 weeks to complete. Focus on 3-5 high-conviction trades rather than numerous marginal setups.
Bull Flag Patterns Across Different Asset Classes
While the structural principles remain consistent, subtle differences exist when trading bull flags across stocks, forex, and cryptocurrencies.
Trading Bull Flags in Stocks
Stock bull flags often emerge following earnings beats, sector rotation, or positive company-specific news.
Key Considerations:
- Pre-market and after-hours gaps can affect pattern structure
- Sector and market correlation influences success rates
- Lower liquidity in small-cap stocks increases slippage risk
- Consider the broader index trend (S&P 500, NASDAQ) before entering
According to research by Thomas Bulkowski, whose database contains thousands of chart patterns across decades, bull flags in stocks succeed approximately 68% of the time when volume requirements are met.
Trading Bull Flags in Forex
Currency pairs exhibit cleaner bull flag patterns due to 24-hour liquidity and continuous pricing.
Key Considerations:
- Economic data releases and central bank announcements can invalidate patterns
- Consider correlation between pairs (EUR/USD and GBP/USD often move together)
- Time your entries to avoid major news events during the breakout phase
- Major pairs (EUR/USD, GBP/USD, USD/JPY) offer tighter spreads and better execution
The forex market’s continuous nature makes it ideal for multi-timeframe confirmation strategies. INFINOX provides advanced charting and analysis tools specifically designed for forex pattern recognition and execution.
Trading Bull Flags in Cryptocurrencies
Cryptocurrency markets exhibit the most volatile bull flag patterns, offering both higher profit potential and increased risk.
Key Considerations:
- Extreme volatility can create false breakouts more frequently
- 24/7 trading means patterns can develop and break out at any time
- Lower liquidity in altcoins increases slippage and manipulation risk
- Consider Bitcoin’s trend when trading altcoin bull flags (most altcoins correlate with BTC)
Cryptocurrency-Specific Adjustments:
- Require higher volume confirmation (2-3x consolidation average)
- Use wider stops to accommodate normal volatility
- Consider partial profit-taking more aggressively due to reversal speed
- Monitor Bitcoin and Ethereum charts even when trading other cryptocurrencies
The Future of Bull Flag Pattern Trading
As algorithmic trading and AI-driven analysis become more prevalent, pattern-based strategies continue to evolve.
Algorithmic Detection and Competition
Modern trading algorithms can detect and act on bull flag breakouts within milliseconds, potentially frontrunning manual traders. This has several implications:
- High-frequency traders may push prices up immediately upon breakout, reducing available entry prices for manual traders
- Pullback entries become more valuable as algorithms trigger initial breakouts
- Pattern reliability remains intact because the underlying market psychology hasn’t changed
Research suggests that patterns continue to work because they reflect fundamental market psychology rather than historical artifacts. A 2023 study examining pattern performance over 20+ years found minimal degradation in bull flag success rates despite increased algorithmic participation.
Combining Traditional Pattern Analysis with Modern Tools
Progressive traders increasingly combine classical pattern recognition with:
- Sentiment analysis: Social media and news sentiment scoring helps confirm or question pattern validity
- Order flow analysis: Examining bid-ask dynamics and order book depth provides insight into institutional positioning
- Machine learning confirmation: AI models trained on thousands of historical patterns can provide probability scores for current setups
Platforms like those offered by INFINOX integrate these advanced analytical capabilities with traditional charting tools, enabling traders to leverage both classical technical analysis and modern quantitative methods.
Key Takeaways for Trading Bull Flag Patterns
Success with bull flag chart patterns requires discipline, patience, and systematic execution:
- Pattern identification must be rigorous: Only trade flags with clearly defined flagpoles, proper consolidation structure, and appropriate timeframe
- Volume confirmation is non-negotiable: Breakouts on insufficient volume fail 60-70% of the time
- Risk management supersedes pattern recognition: Even perfect patterns require proper position sizing and stop-loss placement
- Timeframe selection matters significantly: Restrict bull flag trading to hourly charts and above for optimal reliability
- Combine with complementary analysis: Use moving averages, support/resistance, and multi-timeframe confirmation to filter setups
- Scale exit strategies enhance profitability: Partial profit-taking balances certainty with extended opportunity
- False breakouts are inevitable: Accept them as a cost of trading continuation patterns and manage risk accordingly
- Patience yields superior entries: Waiting for pullbacks after initial breakouts significantly improves risk-reward ratios
- Market context influences success rates: Bull flags aligned with broader market trends succeed more frequently
- Continuous learning refines execution: Track your trades, analyze outcomes, and adjust your criteria based on personal results
The bull flag pattern remains one of the most reliable continuation patterns available to traders across all experience levels. By combining proper pattern identification with disciplined risk management and multi-factor confirmation, you can leverage this classic chart pattern to identify high-probability trading opportunities consistently.
Whether you’re trading forex through advanced platforms like those offered by INFINOX, analyzing stock charts for swing trades, or navigating cryptocurrency volatility, the bull flag provides a robust framework for identifying when strong trends are likely to resume after brief consolidations. Master this pattern, and you’ll possess a versatile tool that functions effectively across markets, timeframes, and trading styles.


